Final Project
Submission schedule
| Benchmark | Due | Submit |
|---|---|---|
| 1: Project pitch | Mar 24, 2026 | Canvas |
| 2: Meet with Ian | Apr 14, 2026 | Calendly |
| 3: Draft map and reflection | April 21, 2026 | Canvas |
| 4: Project expo | May 5, 2026 | Canvas |
The final project is an opportunity to collect, process, analyze, and visualize spatial data of your own choosing. You must choose a topic and elaborate it in four registers: its topical register, its conceptual register, its technical register, and its graphical register. (Each of these are explained in detail below.)
Spread across about seven weeks of work, your final product will culminate in one of the following:
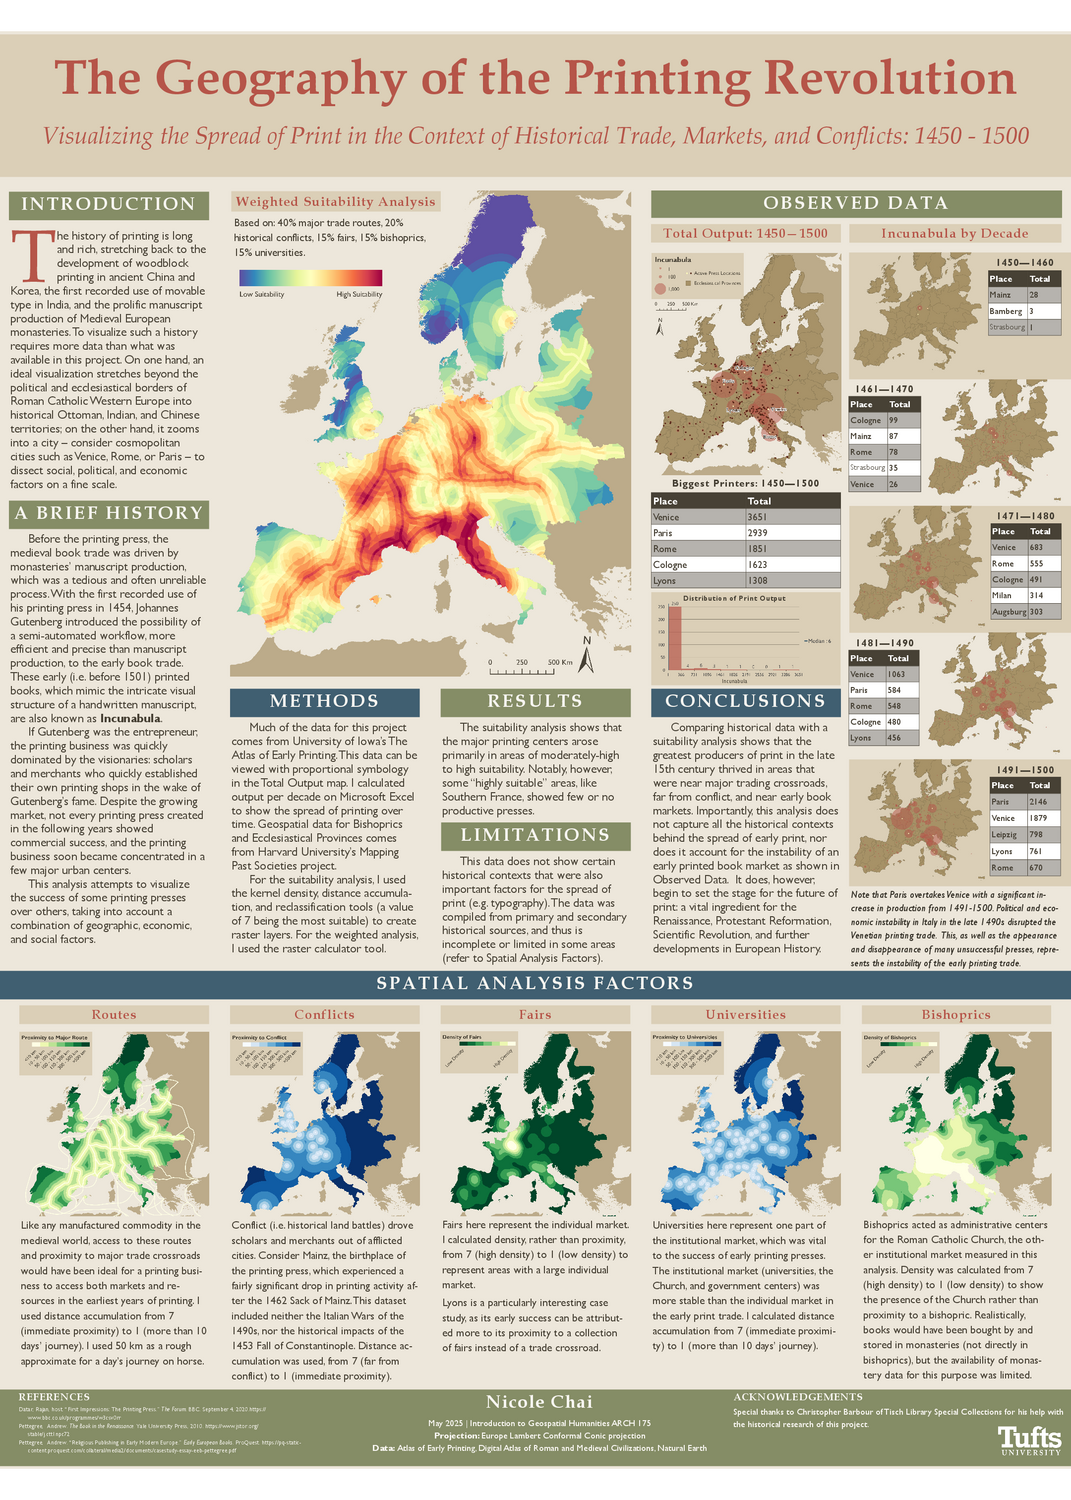
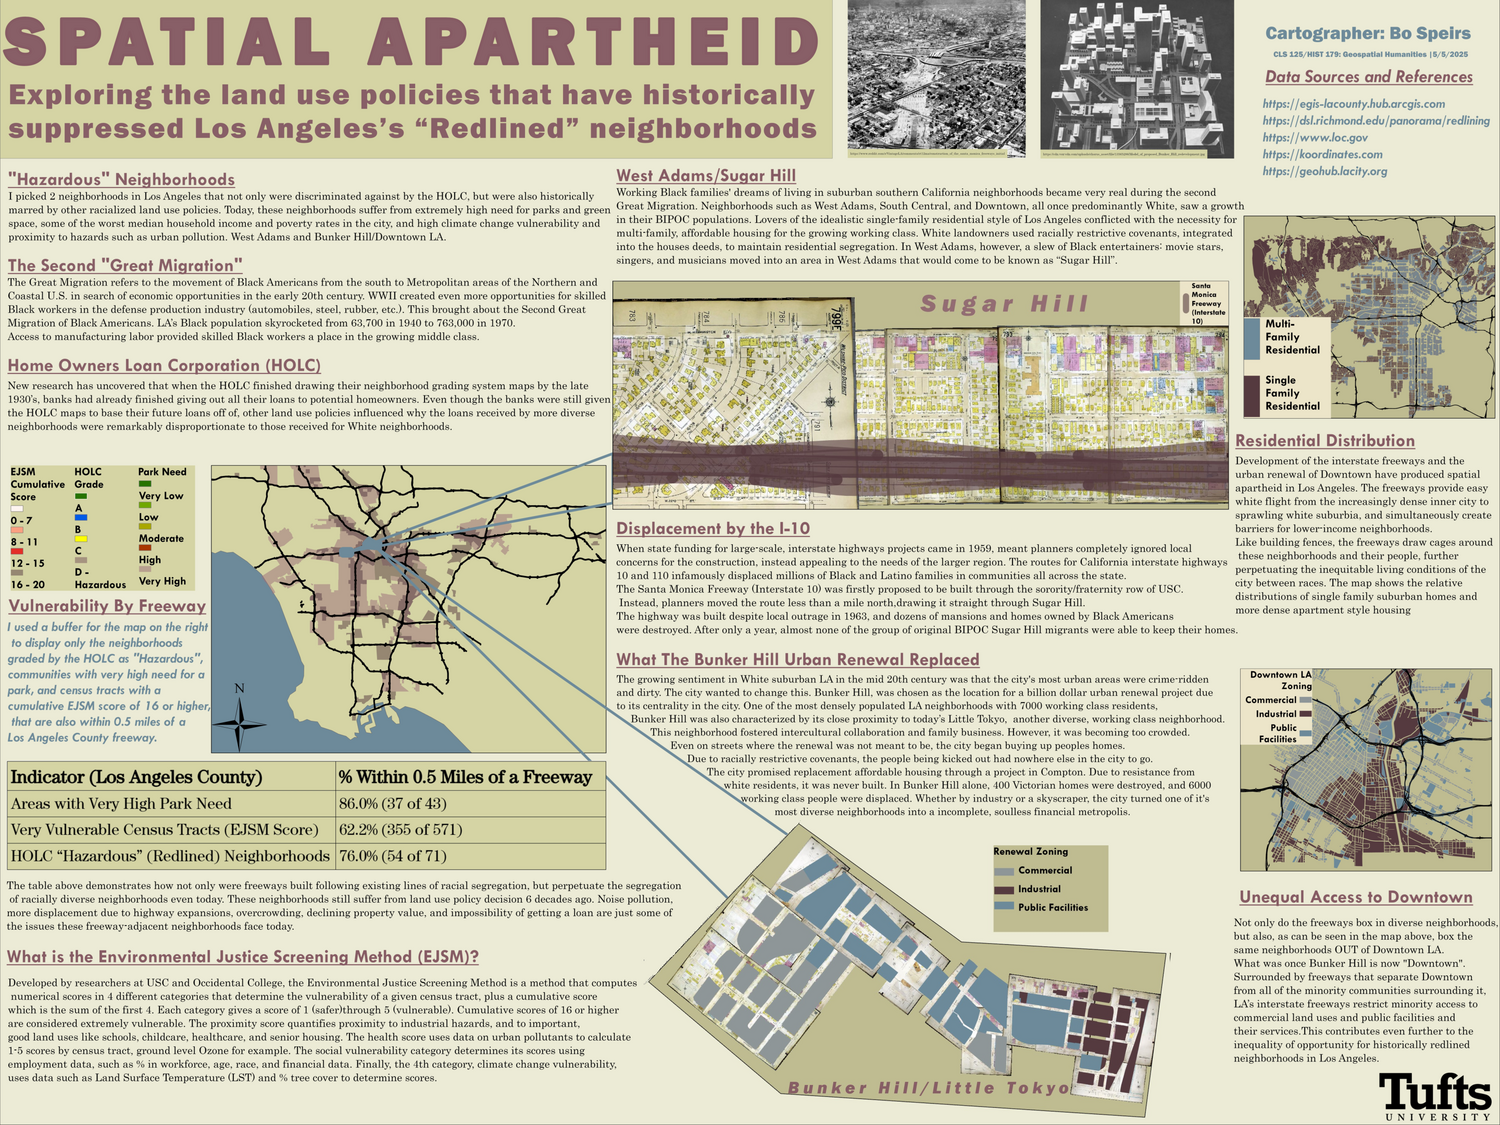
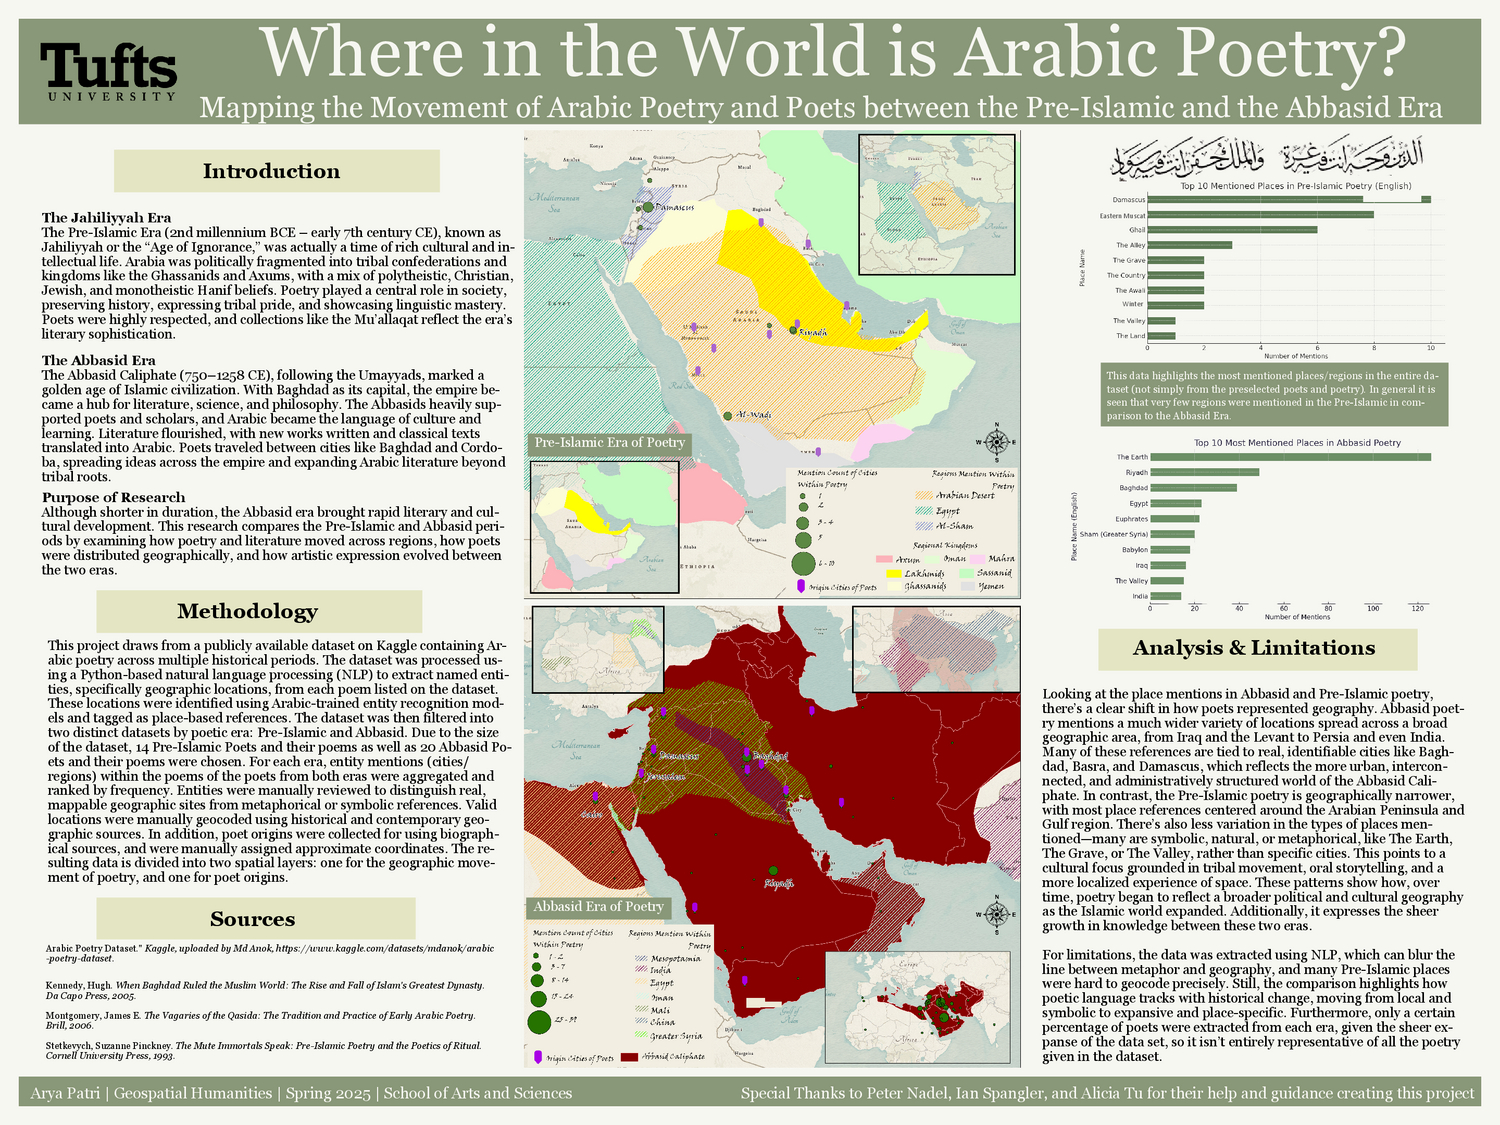
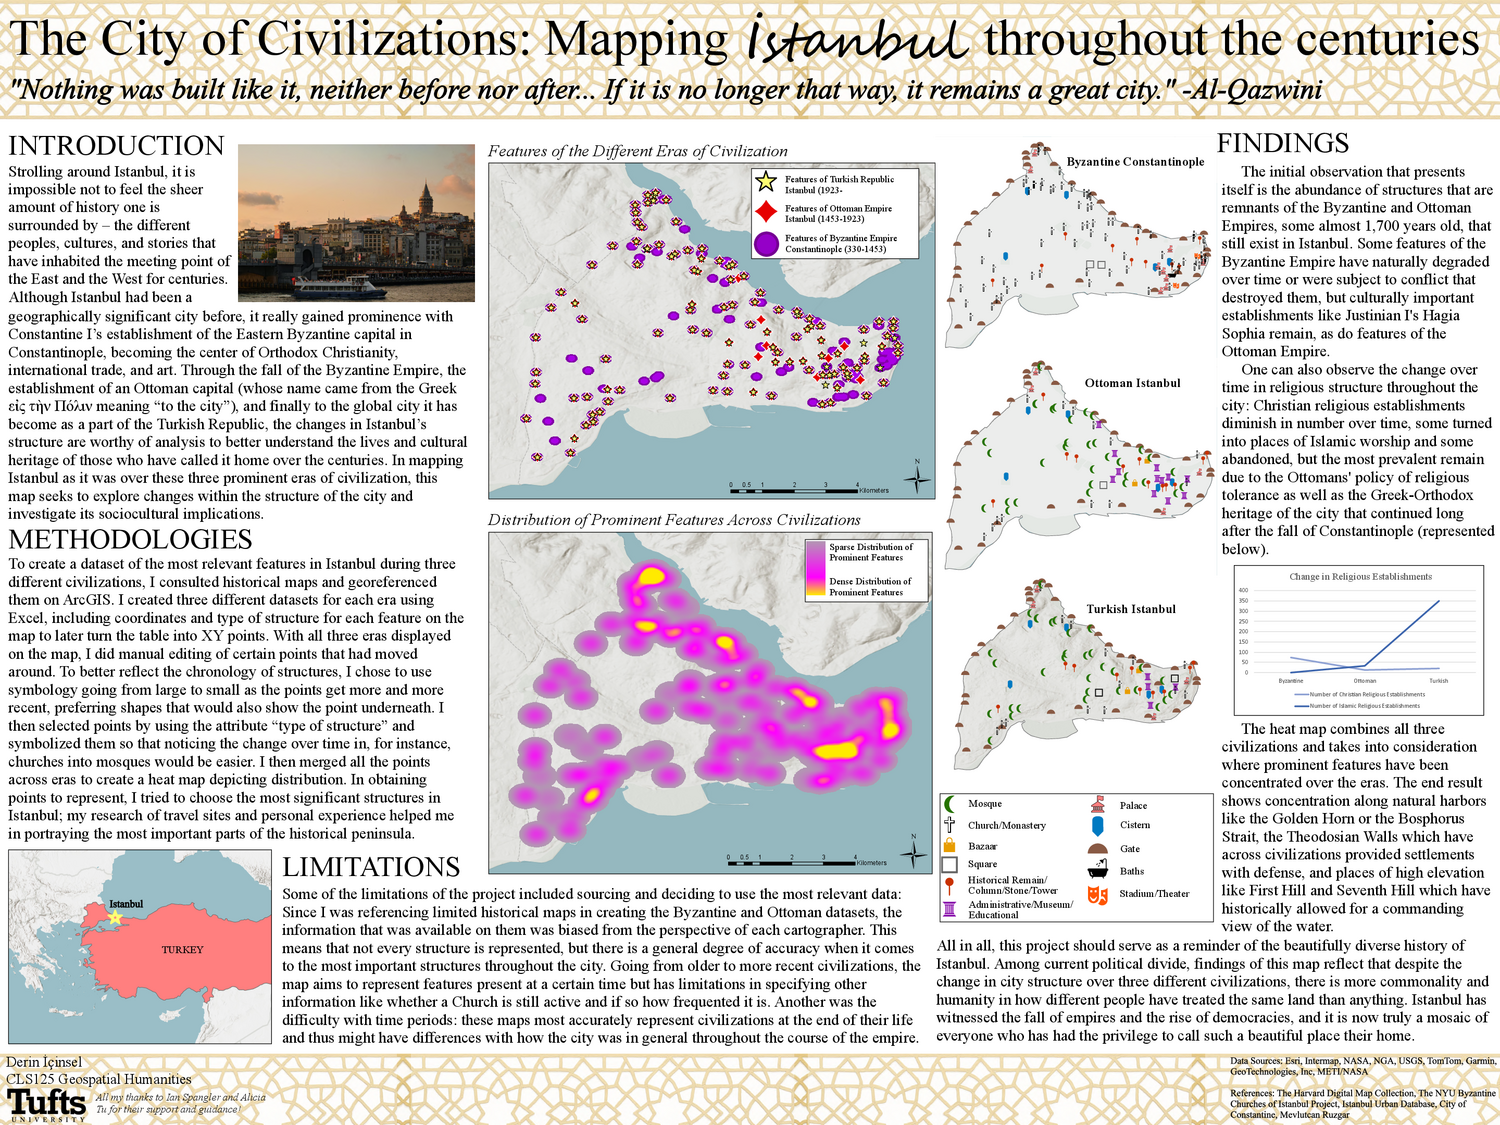
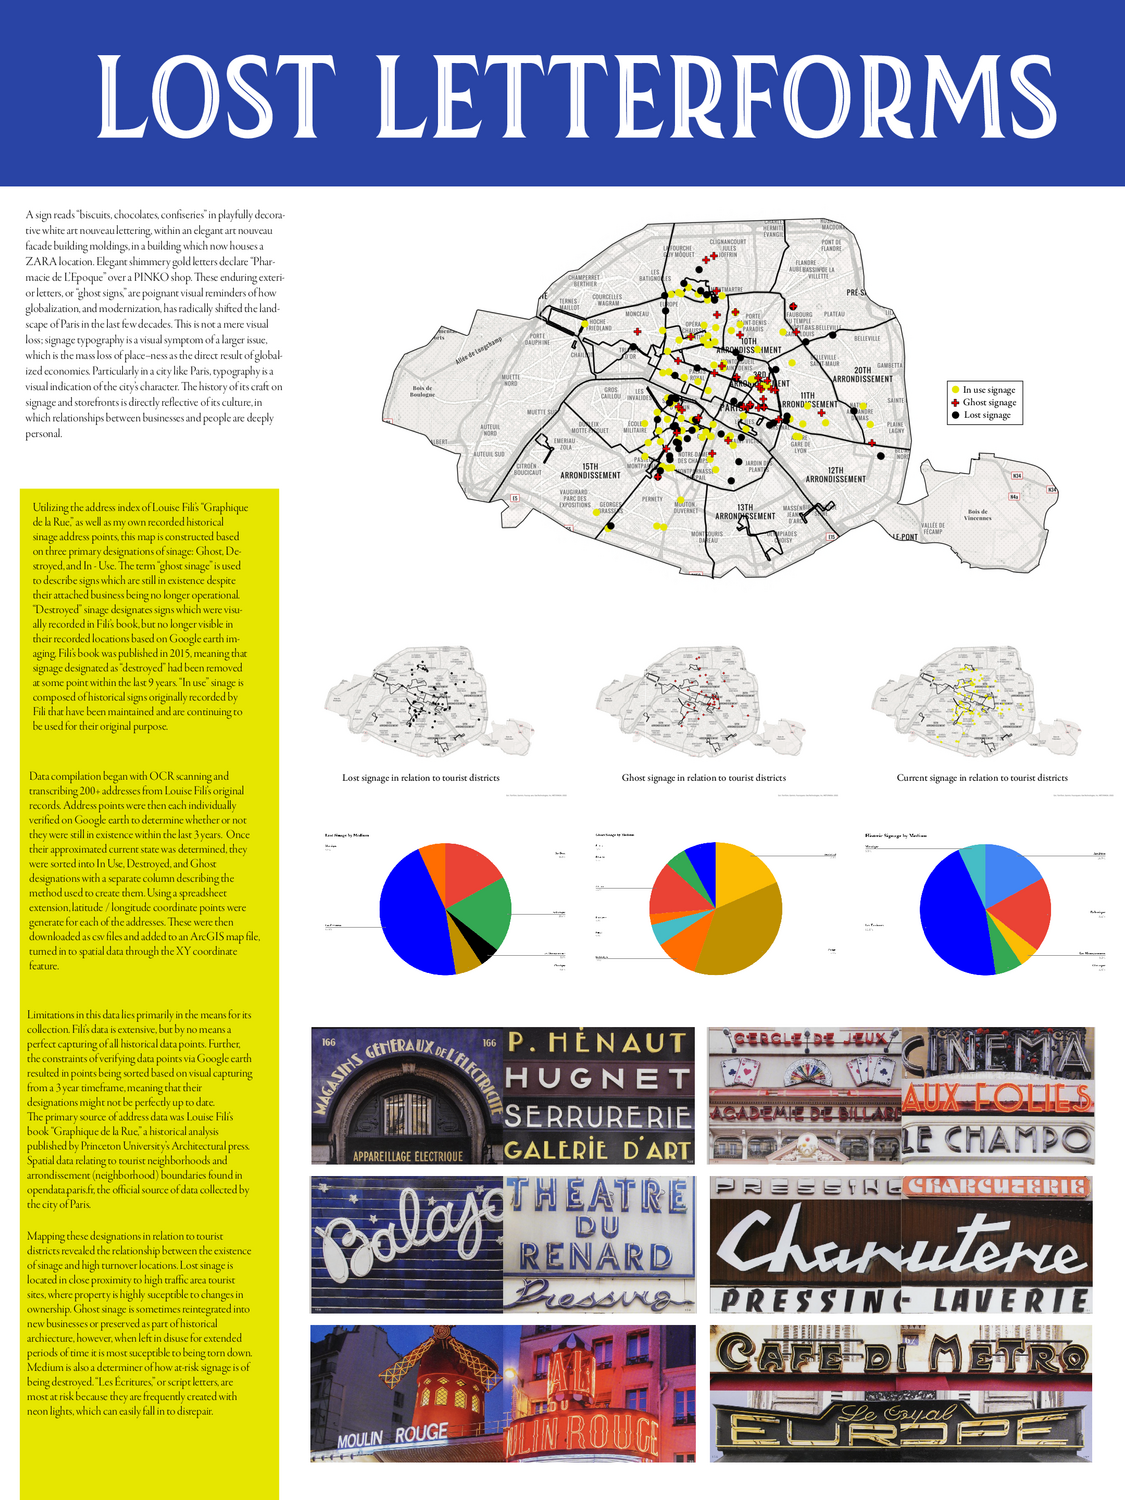
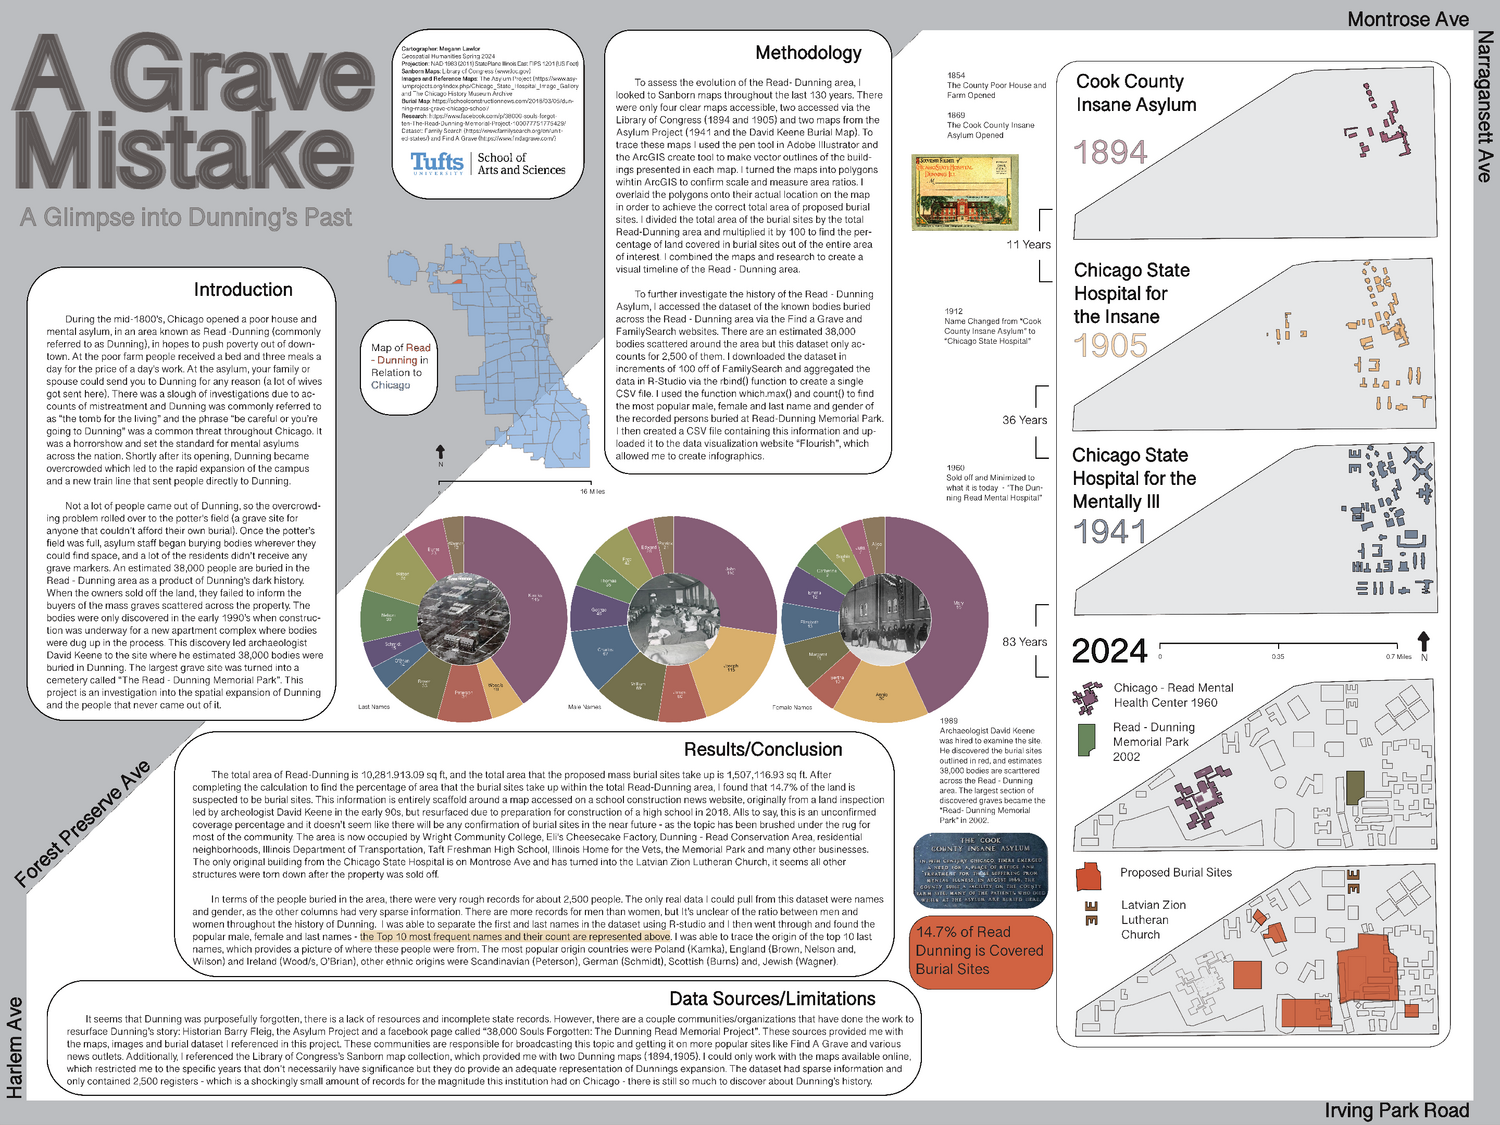
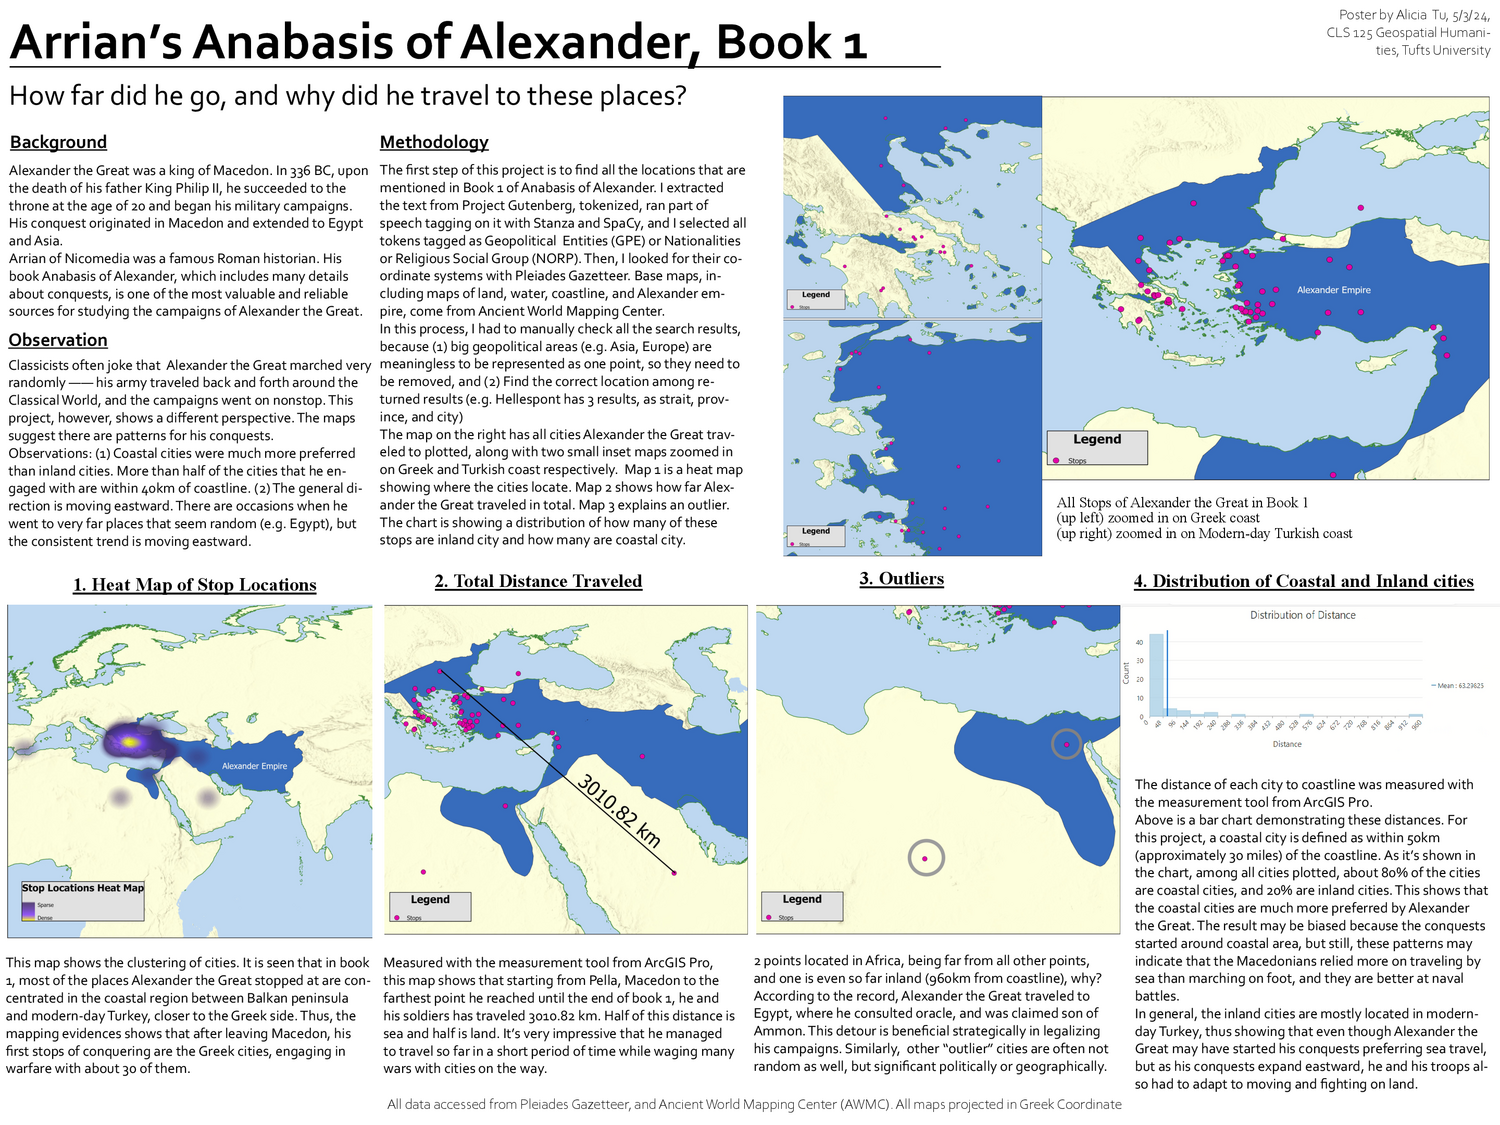
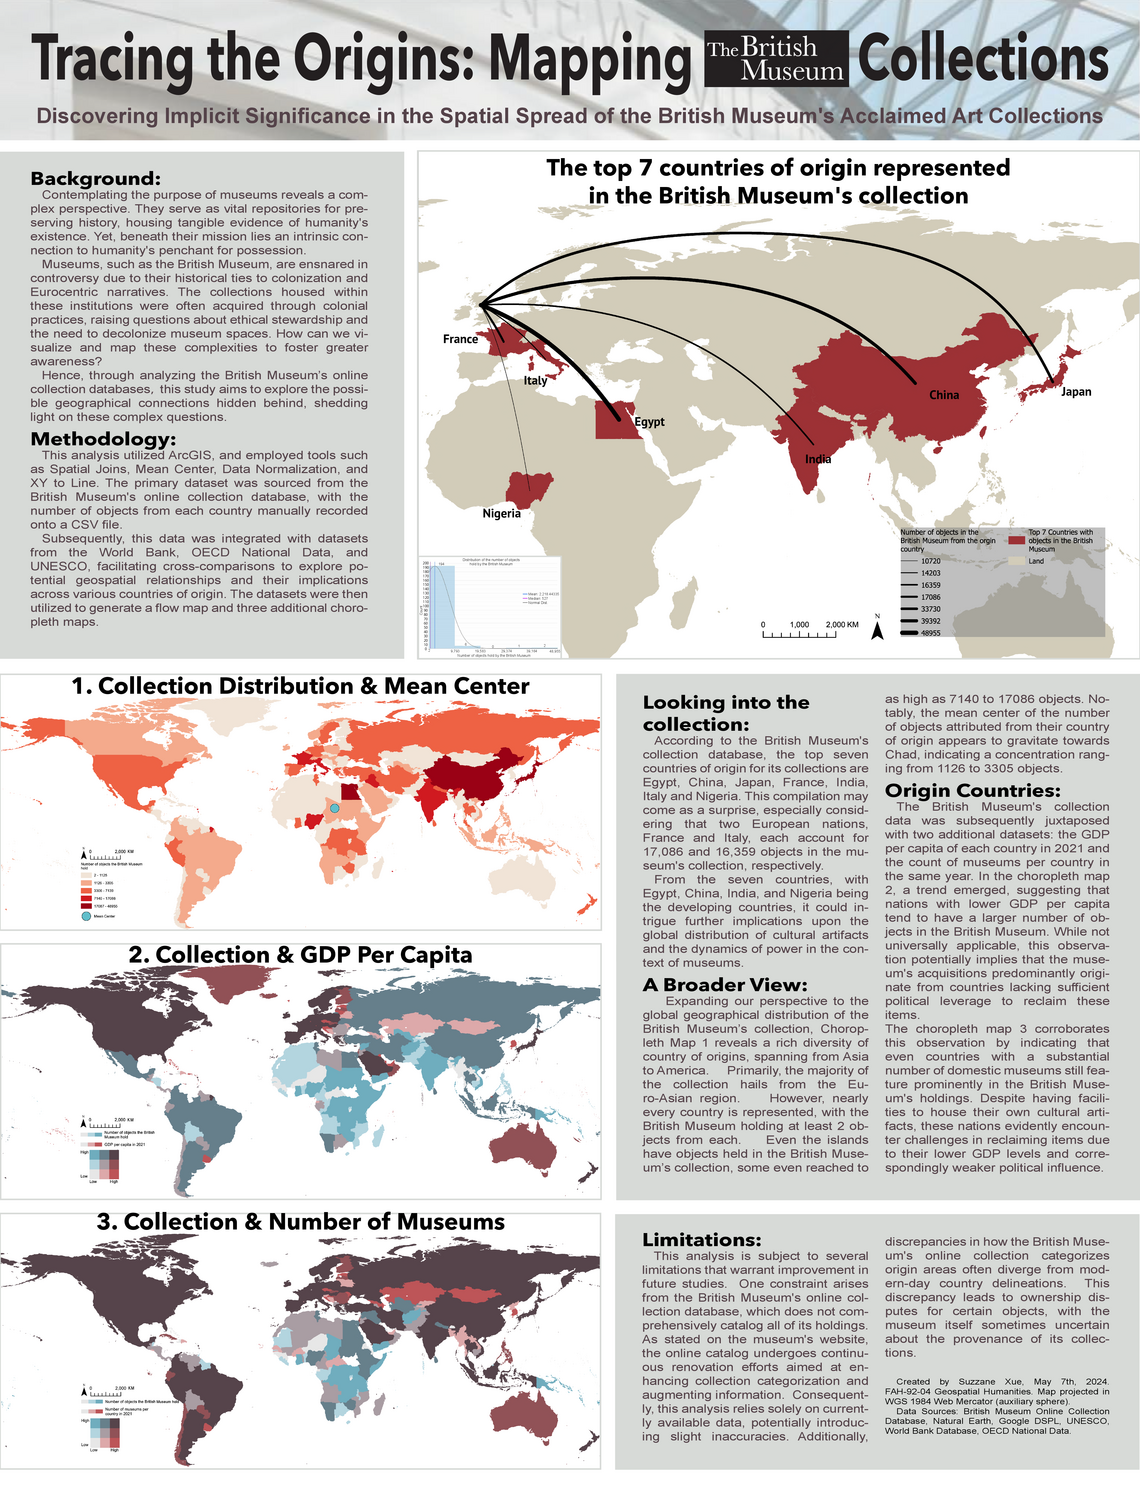
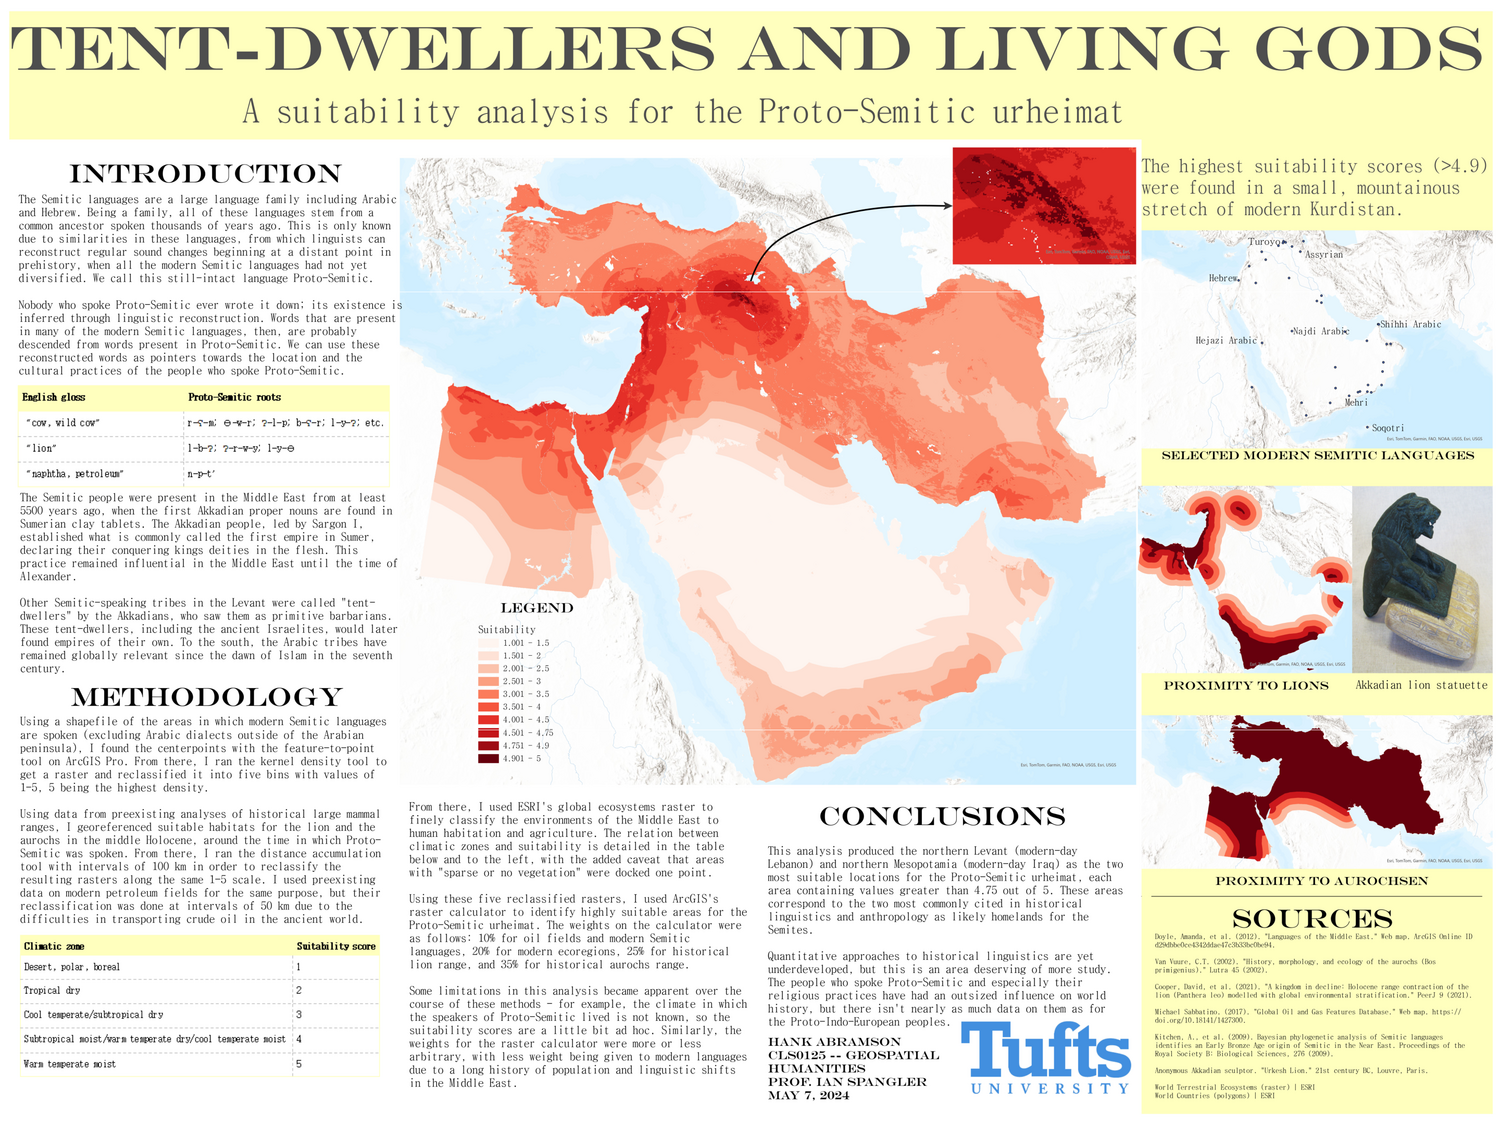
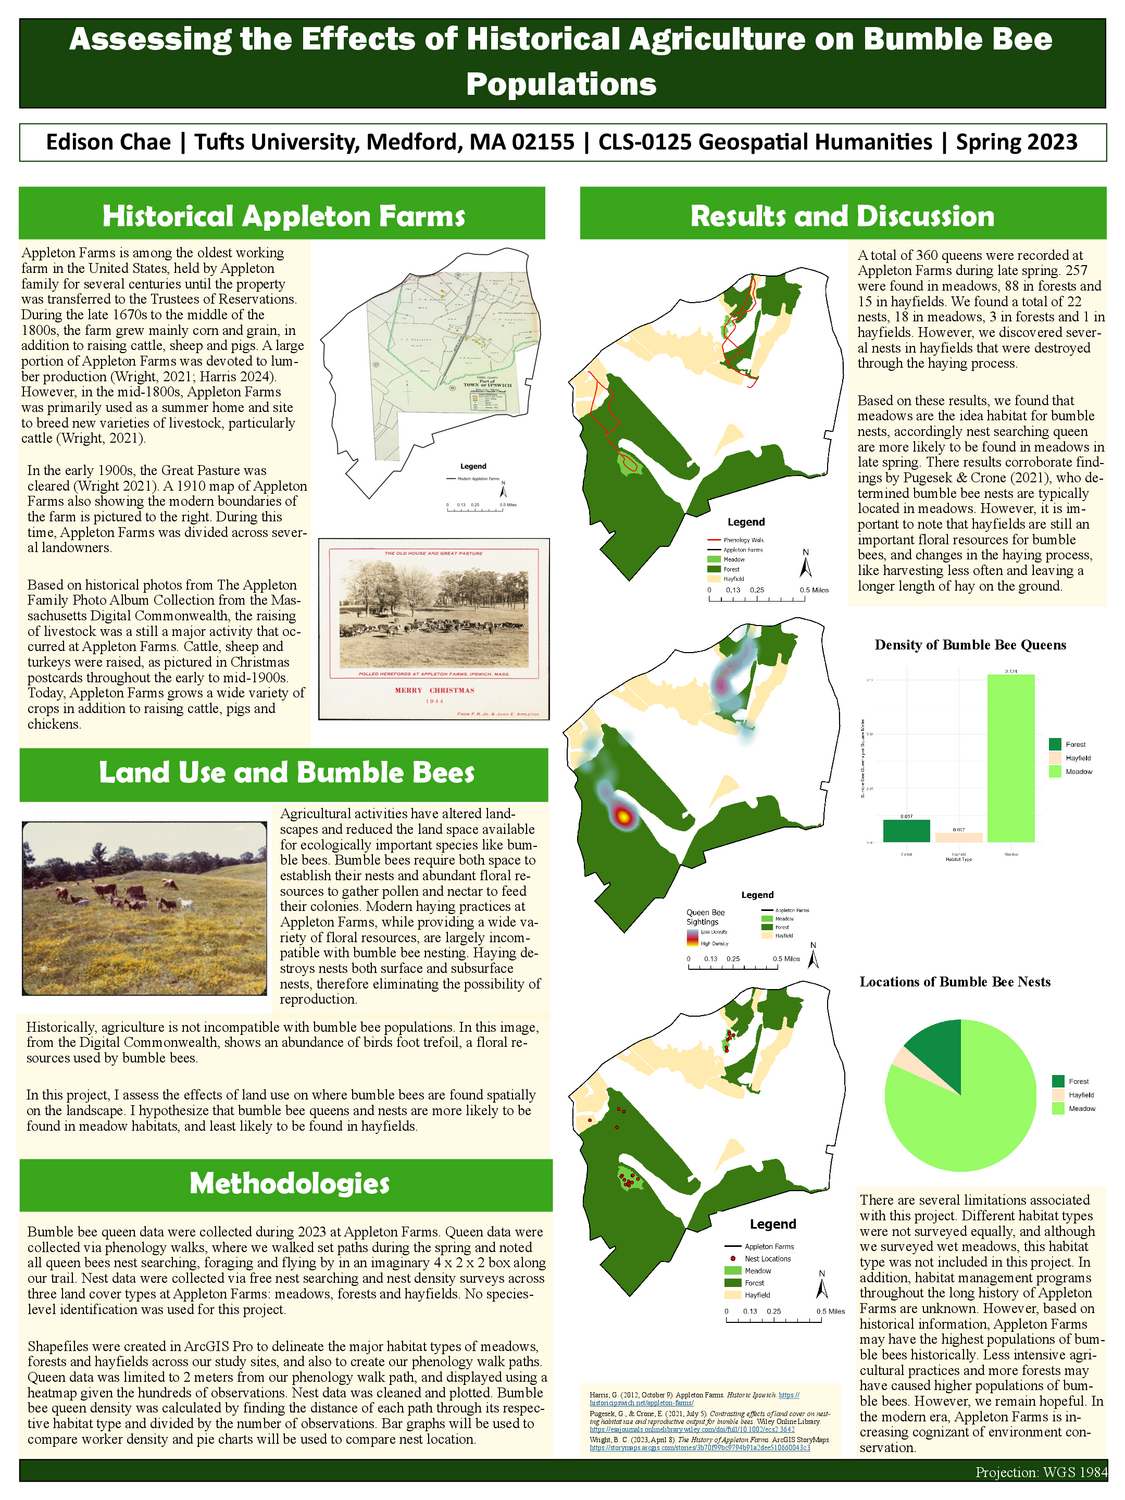
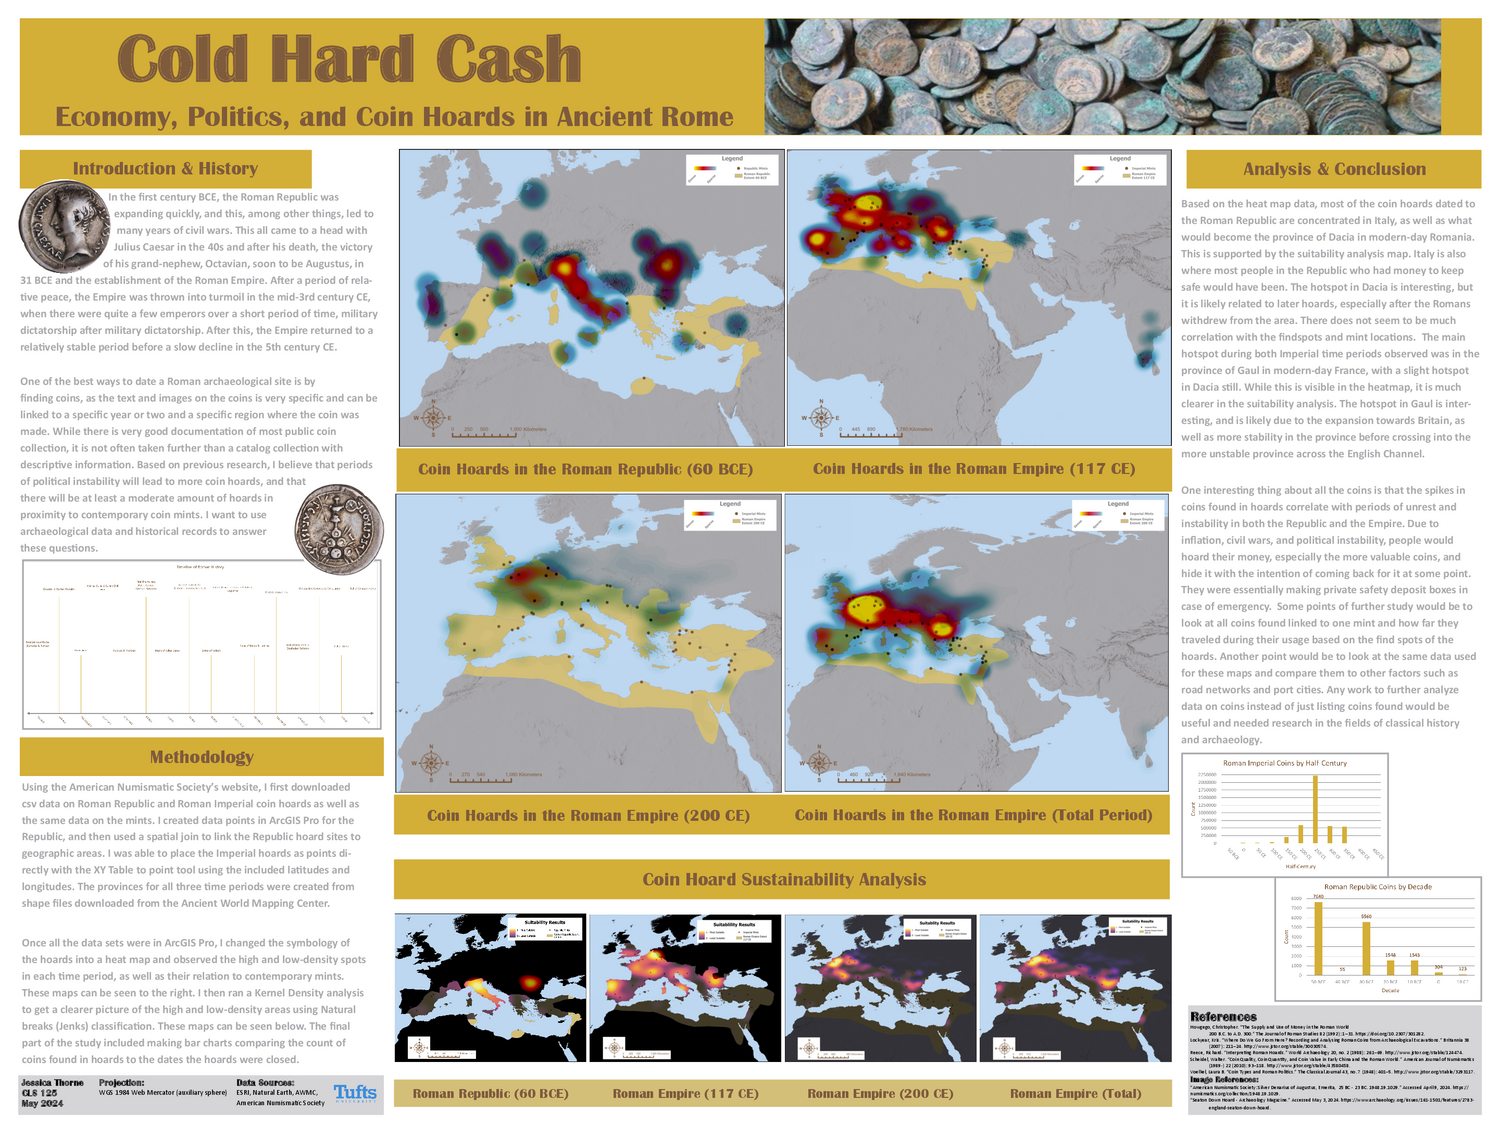
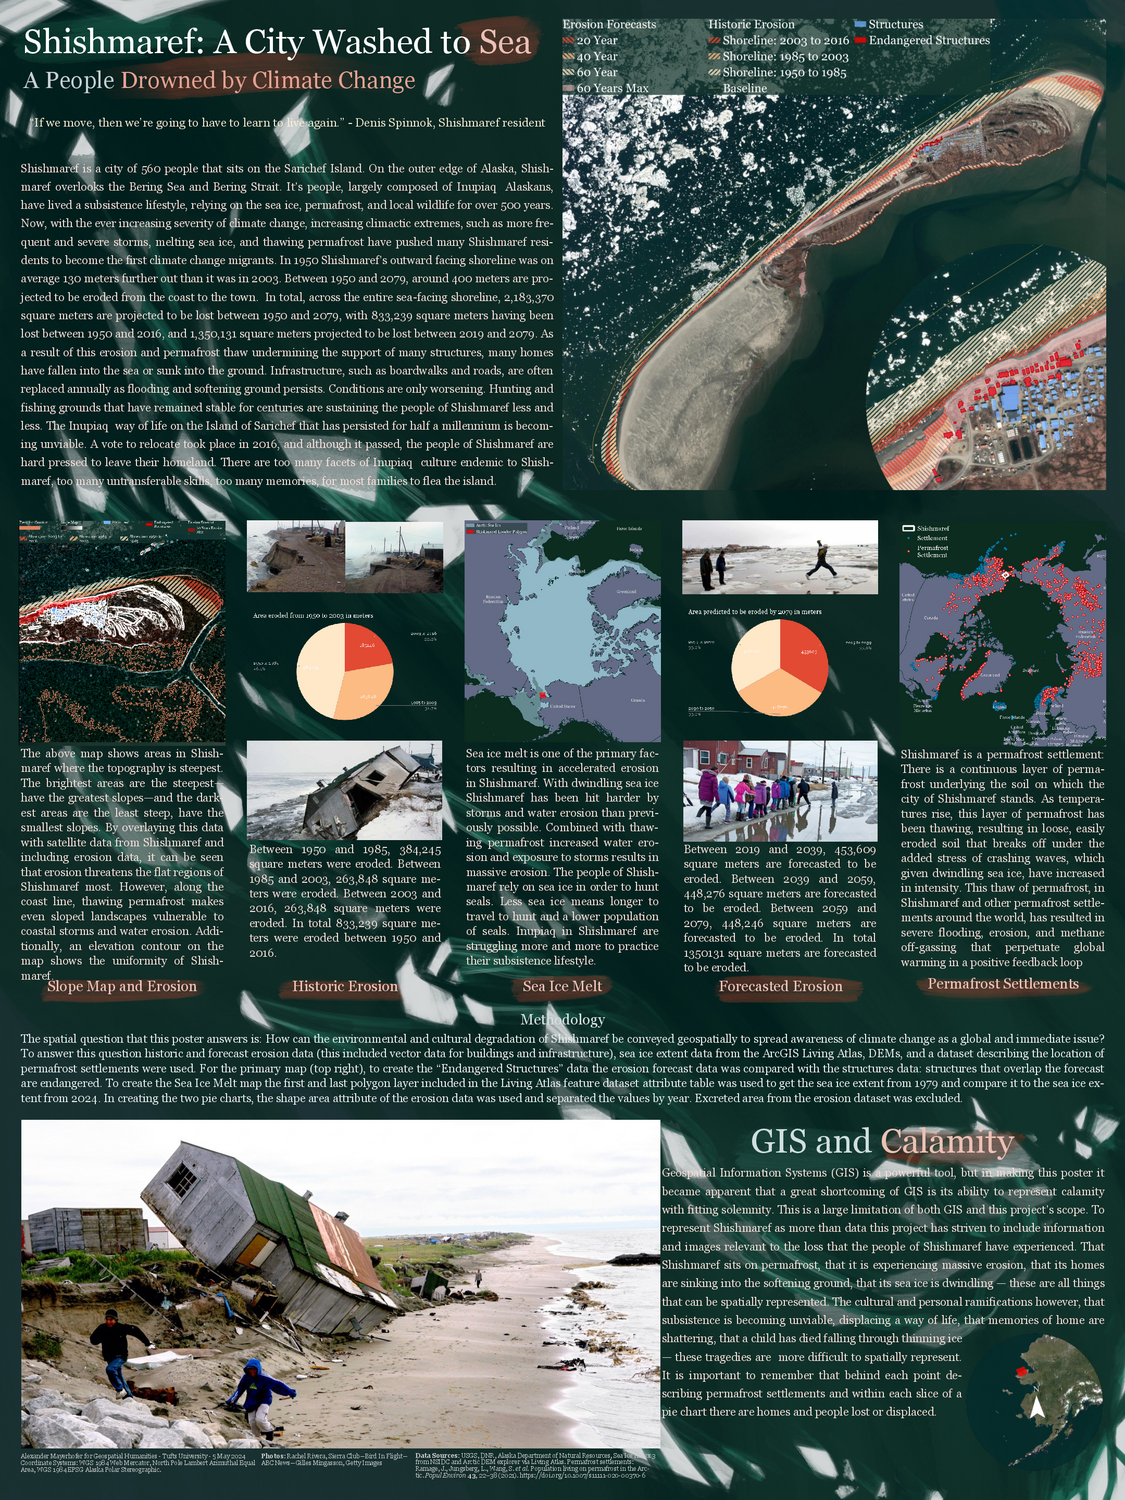
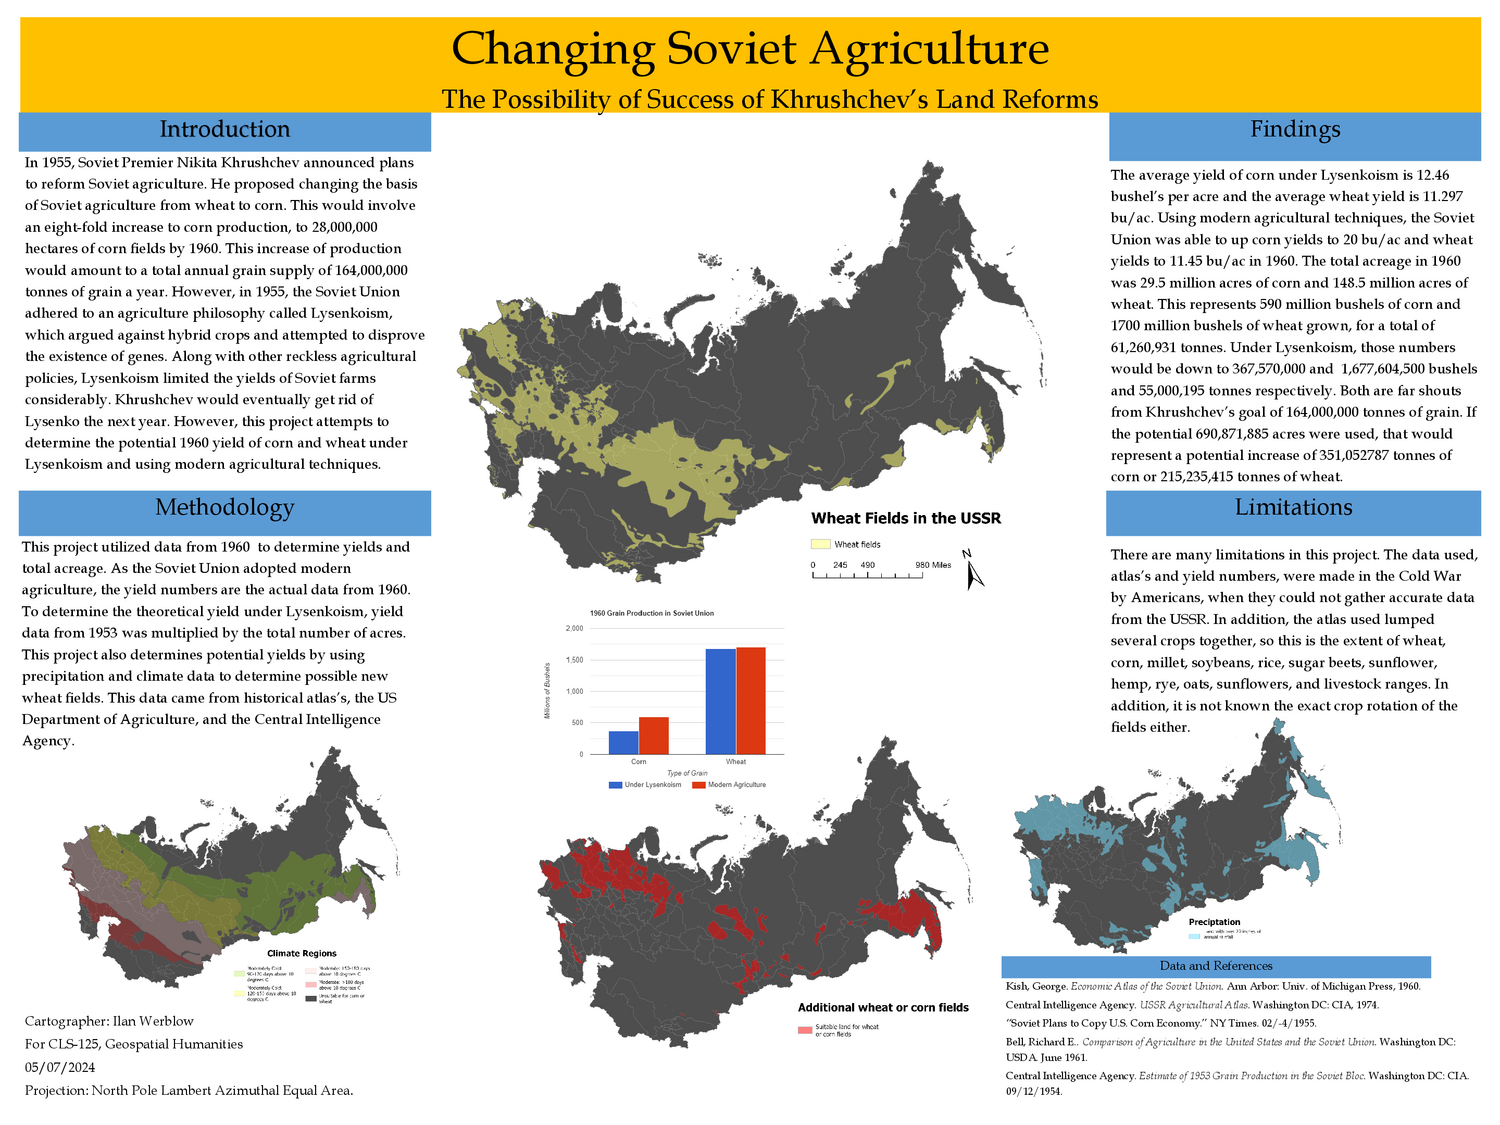
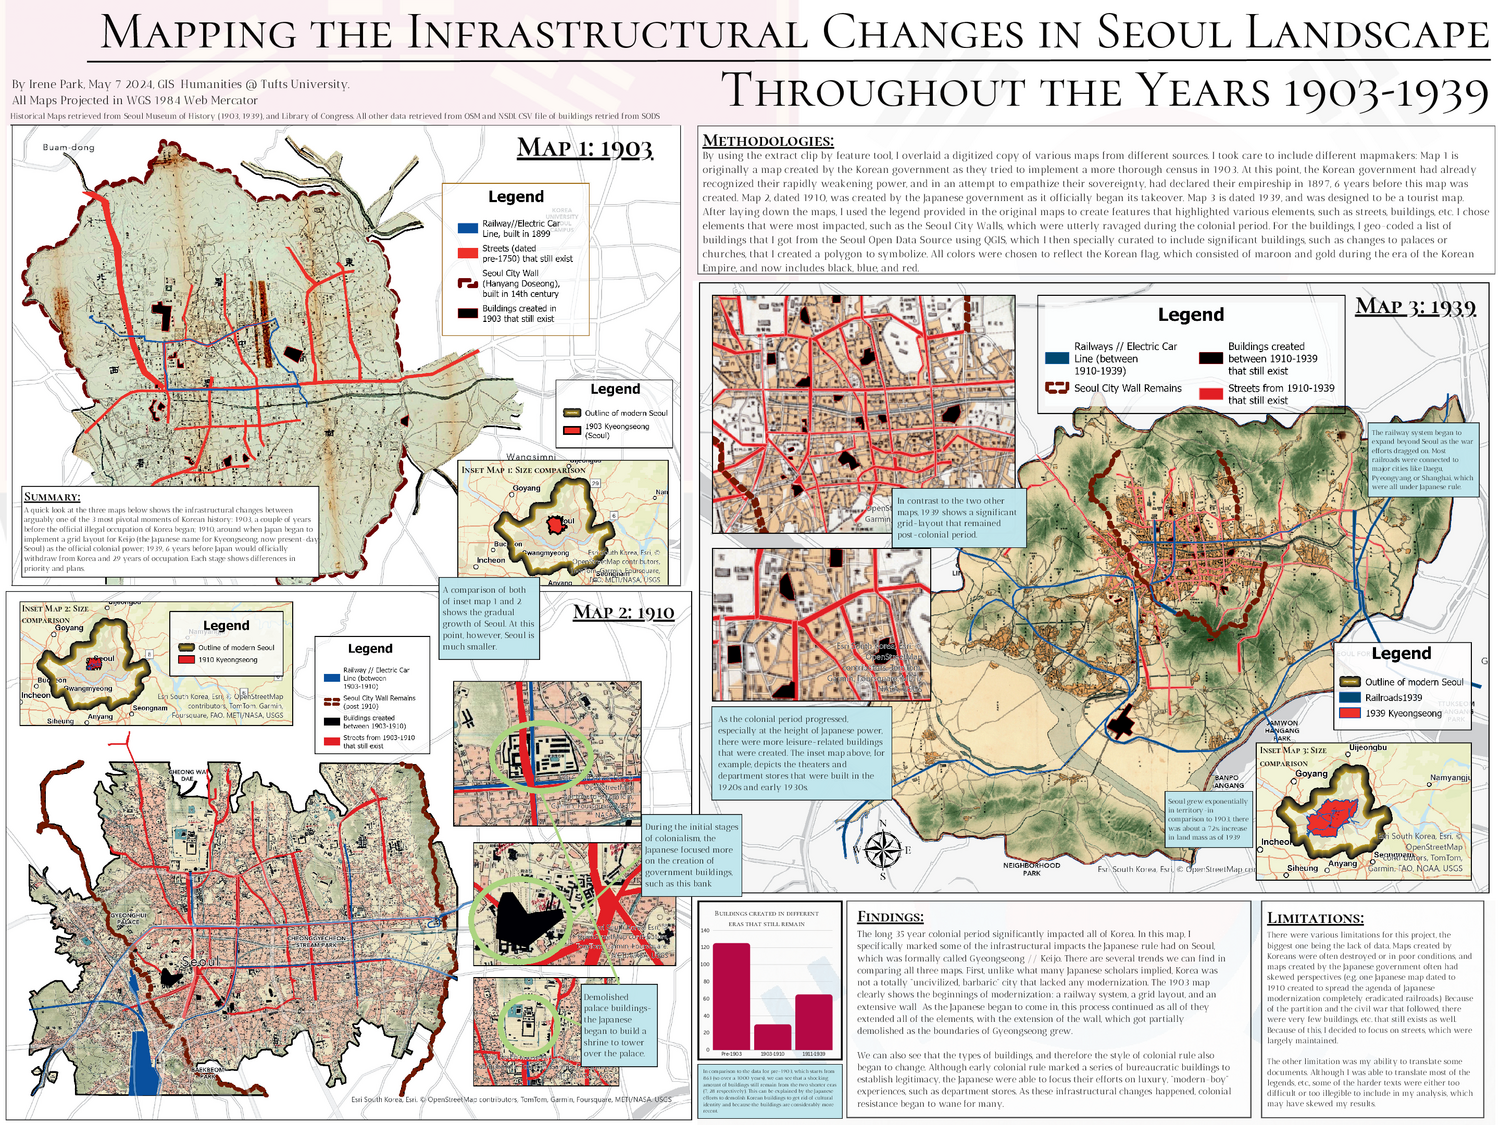
- A large-format infographic that describes the research question, data, and methods as well as the analysis and the results. So long as your infographic engages with all of these points, it could take whatever format you like (e.g., it need not be designed as a scientific poster).
- A digital exhibition (e.g., using Esri’s StoryMap software) which presents your topic through a more curatorial lens.
- Another kind of creative work which draws substantively on course concepts and methods.
In past years, most students have chosen to create a large-format infographic.
Examples
Examples of previous projects can be found at Tufts GIS Expo Explorer. Here’s a sample:
Topical register
The topical register of your project is the empirical content. I think of it as the “what.” Maybe you’re interested in housing discrimination in the early twentieth century United States; maybe you want to explore changing place names in Asia Minor; or maybe you want to study representations of space and place in The Odyssey.
Your final project must, in some way, deal with geospatial humanities. The project need not be historical in nature, but it should have something to do with the humanities from a topical perspective (e.g., art, language, architecture, archaeology, literature, music, cinema, history, debate, classical texts, and so on).
Conceptual register
The conceptual register of your project is what hooks the empirical content into a theoretical framework. This is your project’s “so what.” What is your theory of housing, home, and discrimination? What can we learn from changing place names in Asia Minor? Why does it matter to view places from The Odyssey on a map? You should be able to explain the conceptual contribution of your project, and just as importantly, situate it within a wider intellectual history.
Technical register
The technical register describes your methodology: in other words, the “how.” What datasets did you use? Vector, raster, both, other? How much should we trust the data and your analysis of it? Did you make the data yourself, or did you find it somewhere? What kinds of tools and workflows did you use? Why did you select those ones?
Graphical register
The graphical register refers to how you choose to display your final product. Let’s call this the “whoa!” Your project should be informed by best practices of cartographic design, whether carefully followed or artfully transgressed. Design should always be in service of your overall argument; keep this in mind each step of the way as you lay out your final project.