Assignment 03
Exhuming the secrets of parking lot cemeteries
| Assigned | Due | Submit |
|---|---|---|
Mar 10, 2026 |
Mar 24, 2026 |
Introduction and context
Cudgel thy brains no more about it, for your dull ass will not mend his pace with beating. And, when you are asked this question next, say “a grave-maker.” The houses he makes lasts till doomsday. Go, get thee in, and fetch me a stoup of liquor.
Gravedigger, Hamlet (Act V, Scene I)
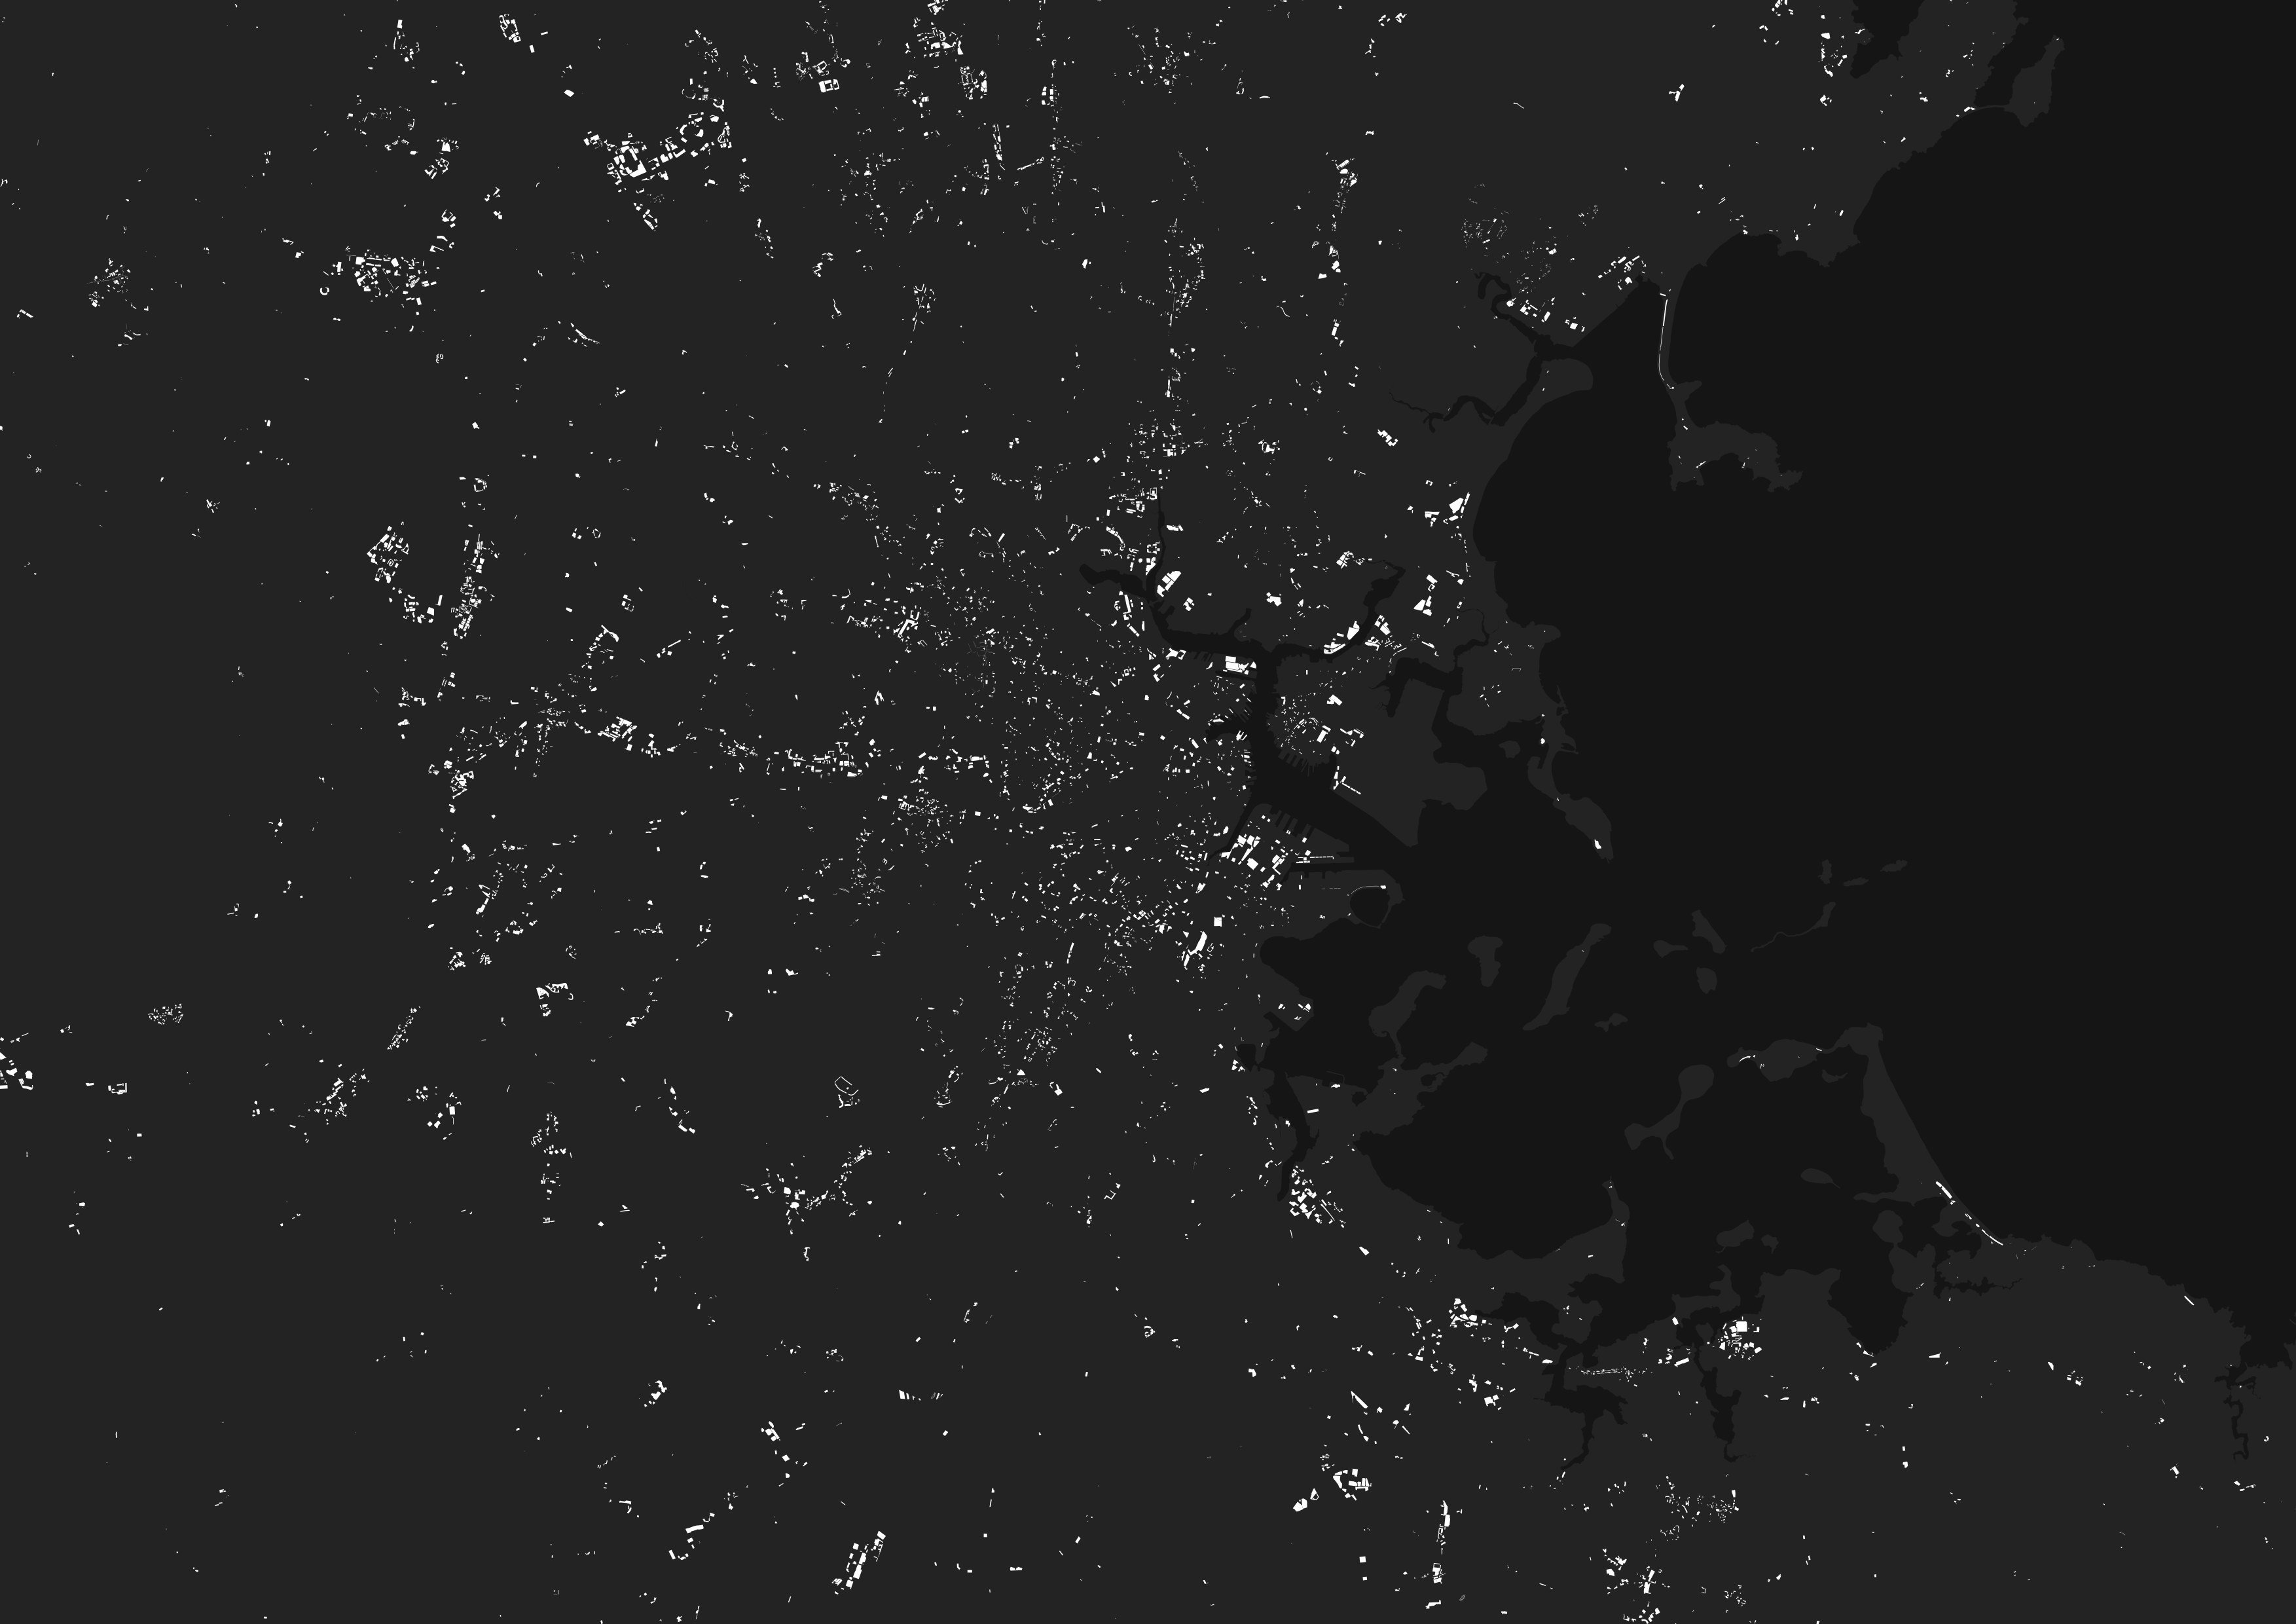
Parking lots only take up about 0.27% of total land area in the commonwealth of Massachusetts. However, that number starts to grow as you zoom into cities and towns. A back-of-the-napkin estimate using data from OpenStreetMap suggests that number goes up by a factor of ten in Boston (2.7%)—and it’s much lower in Boston than most cities in the U.S.
Those numbers might seem small, but balanced against other land uses and land values, they can start to stack up. Moreover, parking lots are a relatively new invention. The turn towards car-dependent urban planning in the twentieth century United States, galvanized by the passage of the 1956 Interstate Highway Act, which provided 90% in federal matching funds for highway construction, radically transformed how people got around.
From a geospatial perspective, what tools exist for visualizing the imprint of parking lots American cities? Perhaps more importantly, how can we adequately assess what we lost through building them?
In short: what kinds of histories are buried under modern-day parking lots?

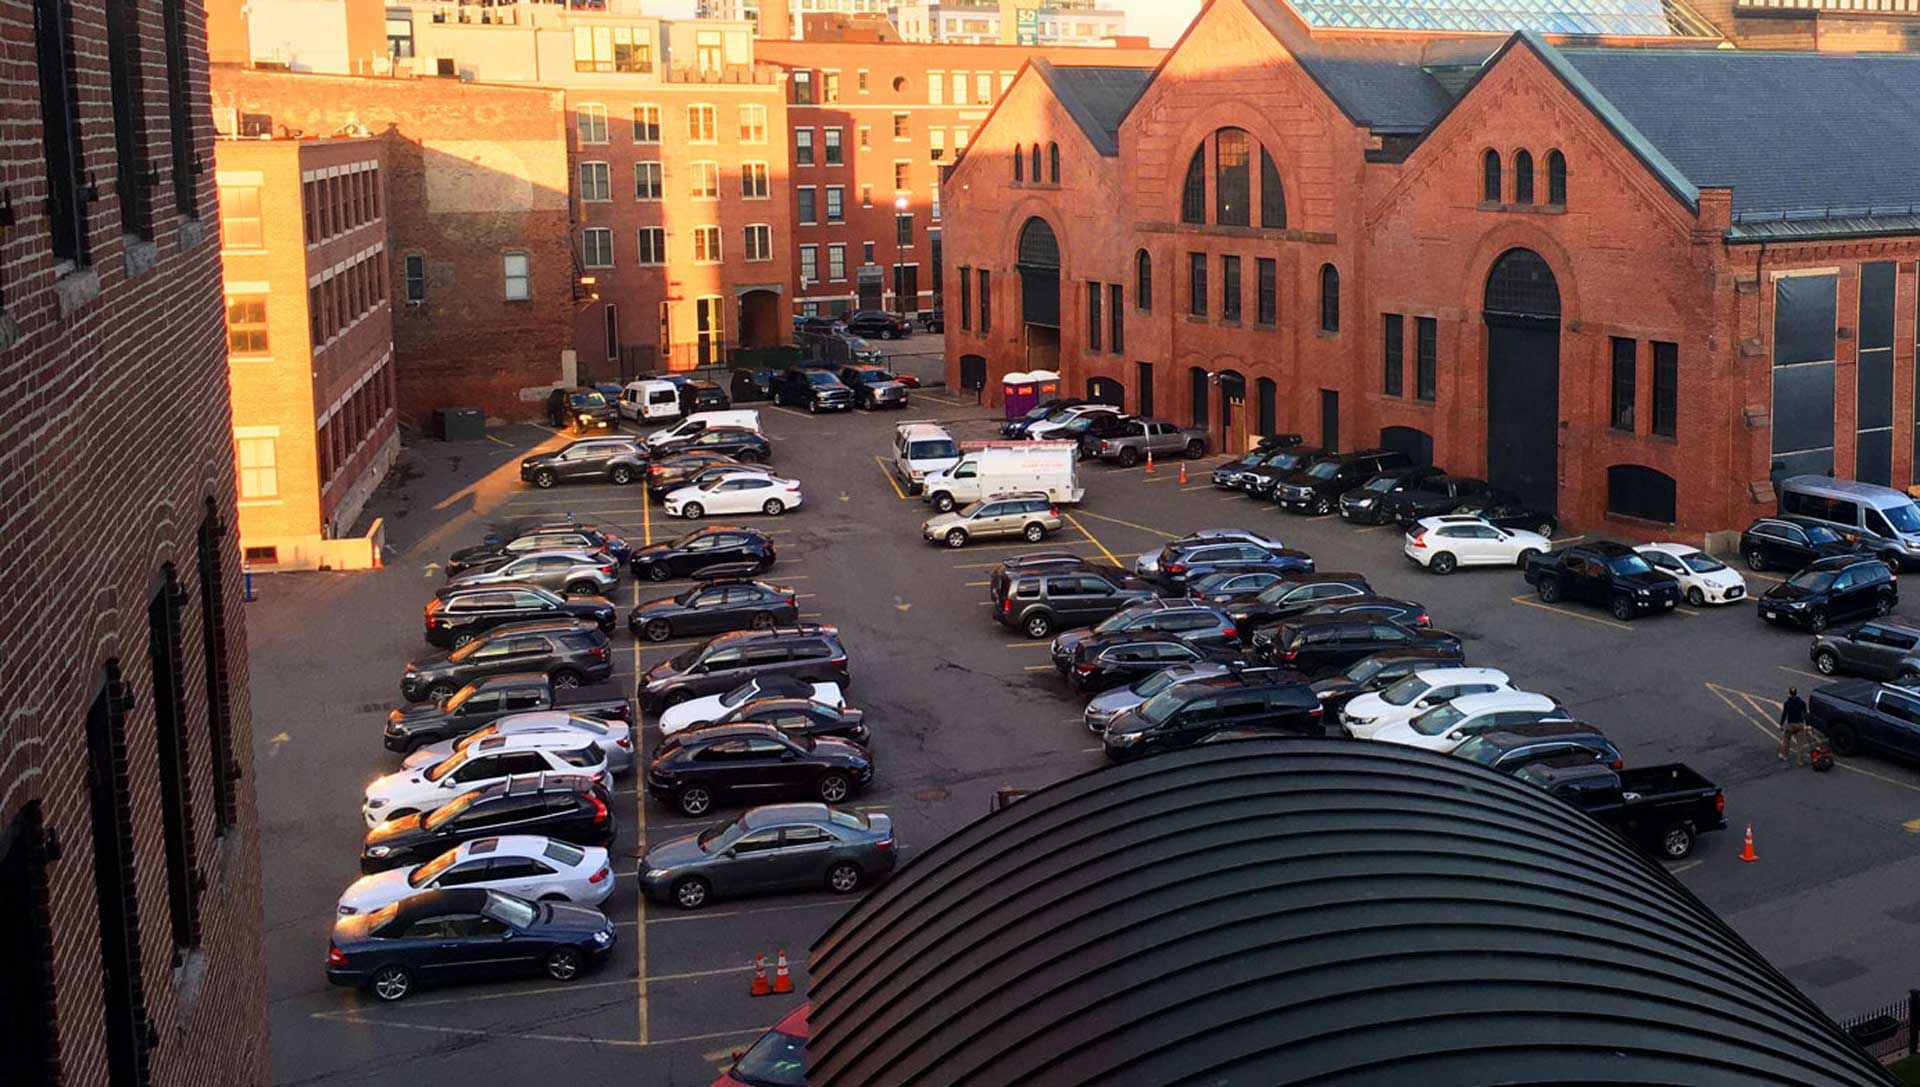
In this assignment, you’ll become—in the parlance of The Bard—a “grave-maker.” Using historic fire insurance and tax atlases, you will make a map of “parking lot cemeteries”—that is, a map of what used to inhabit contemporary parking lots. In ArcGIS Pro, you’ll georeference a few maps from an atlas of your choice, ultimately producing a visualization of what kinds of social and geographic features predated parking lots in the landscape.
Objectives
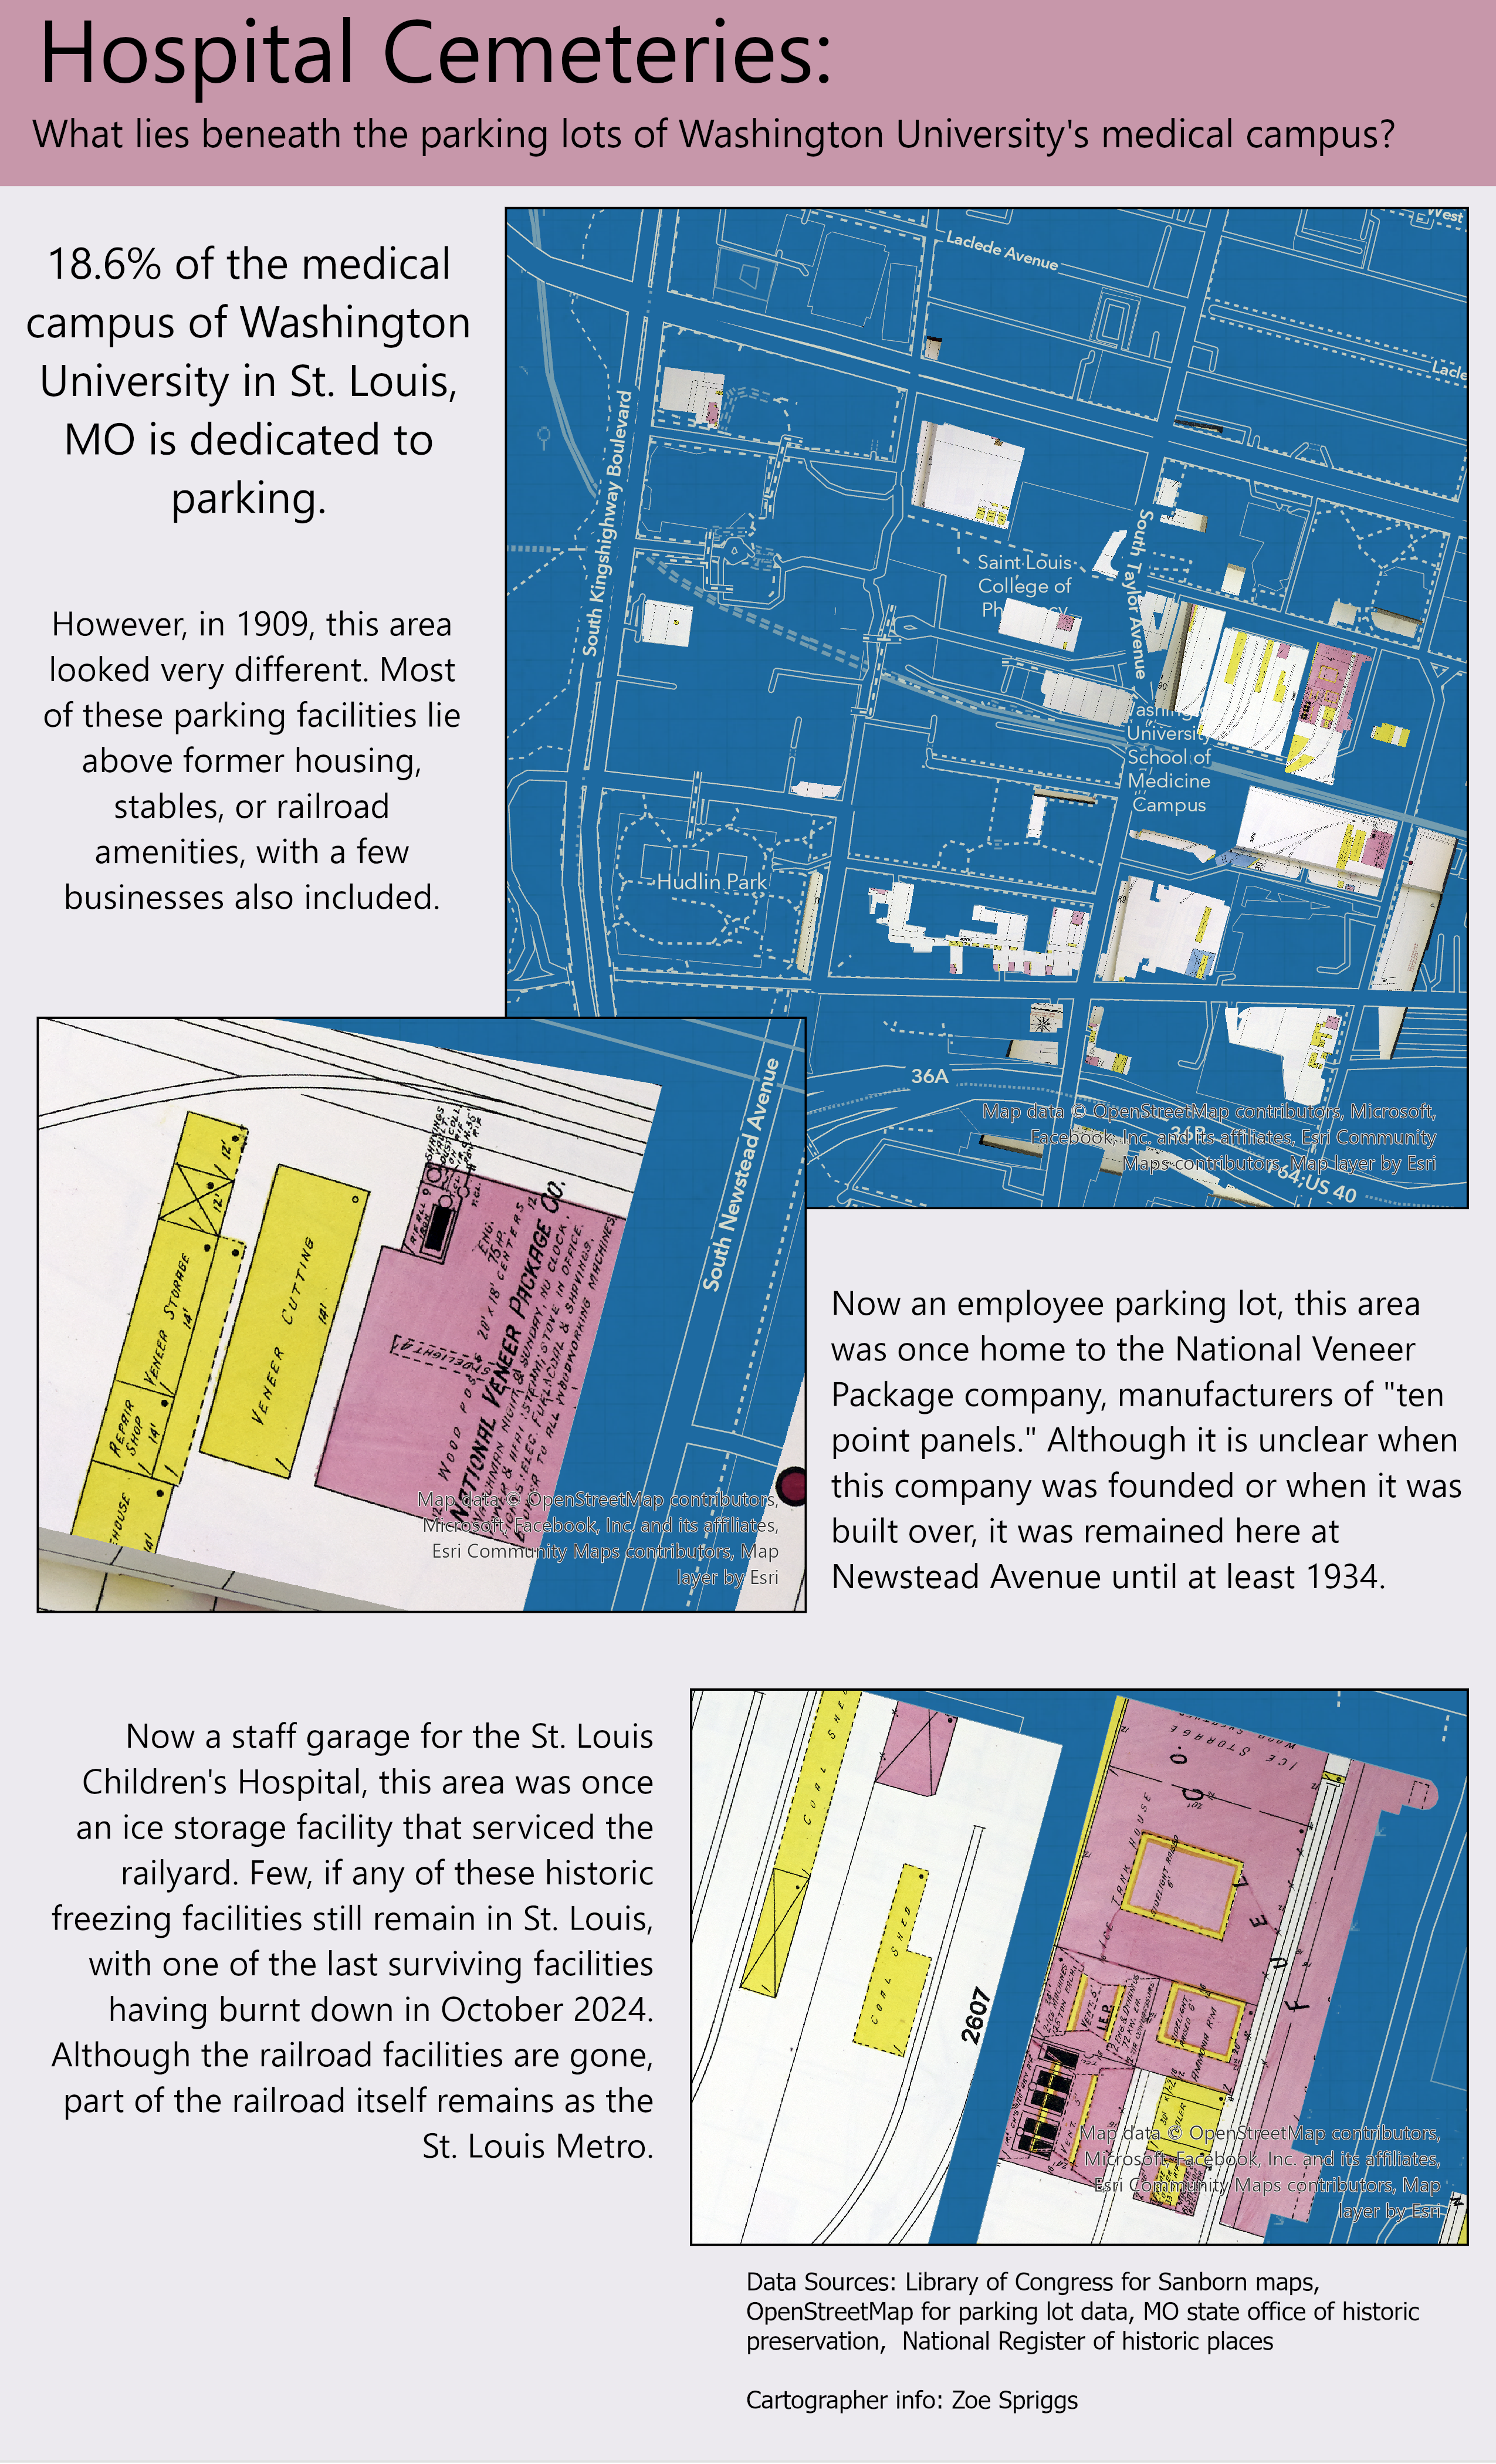
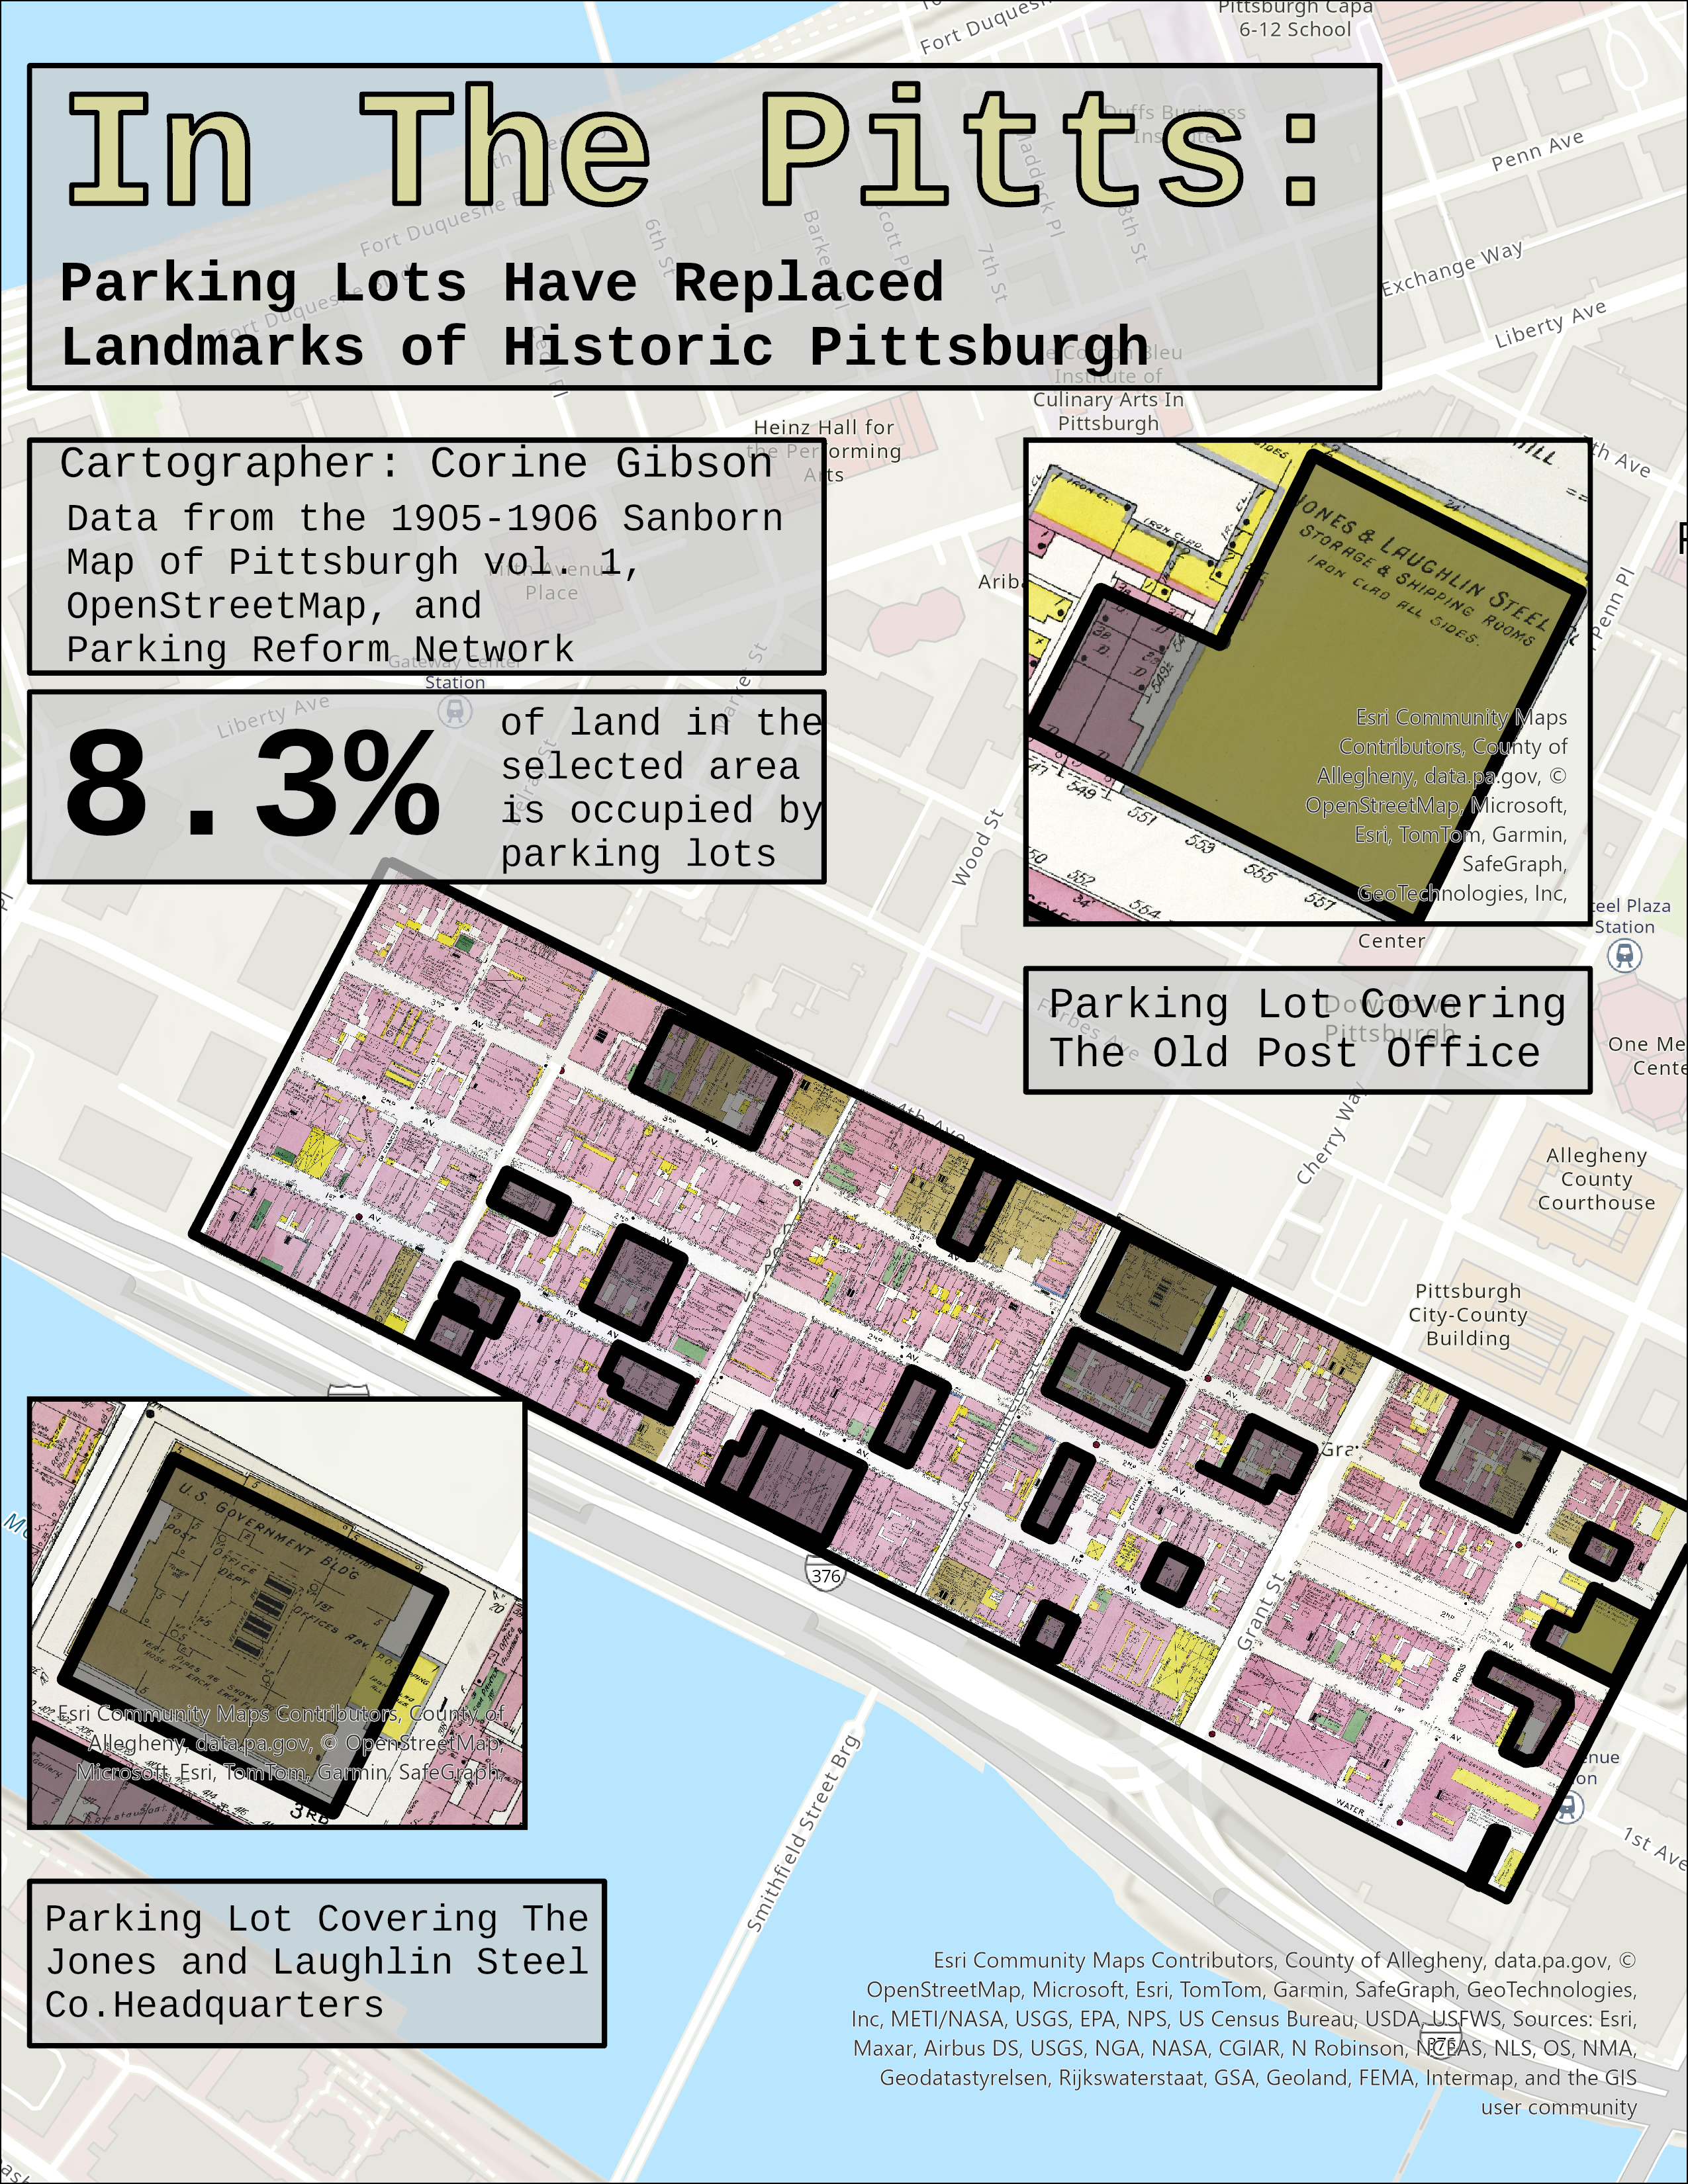
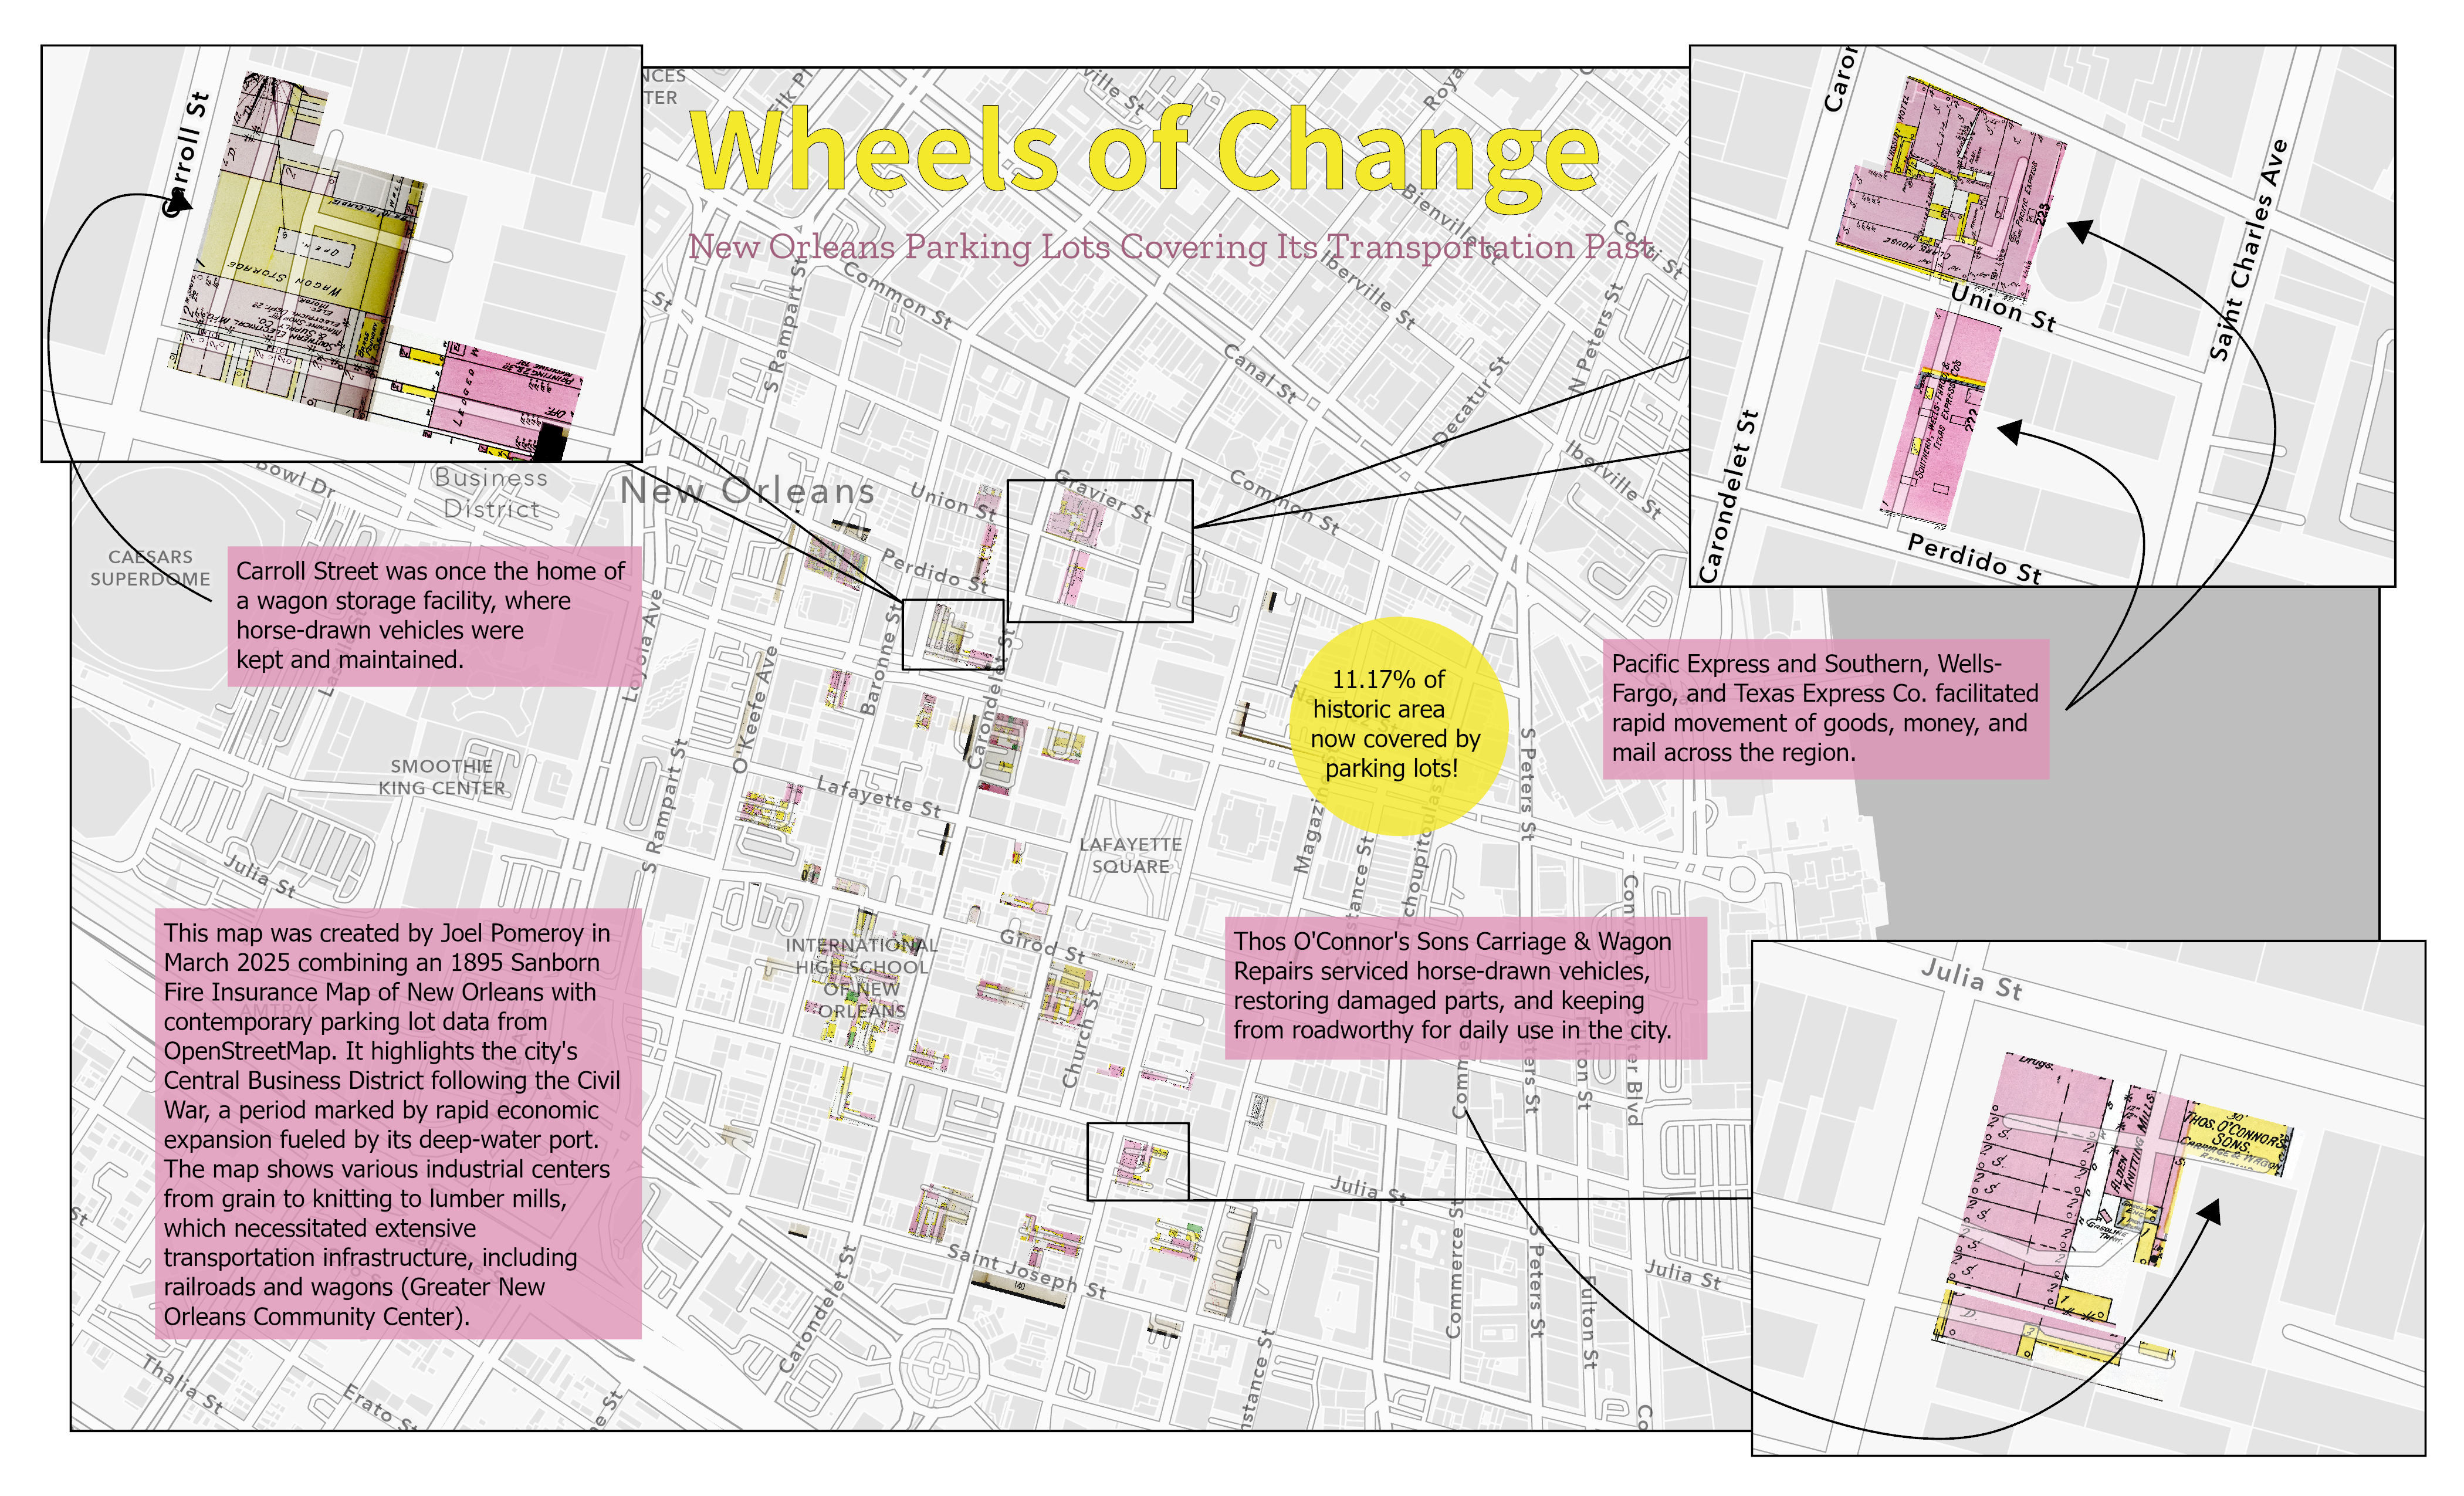
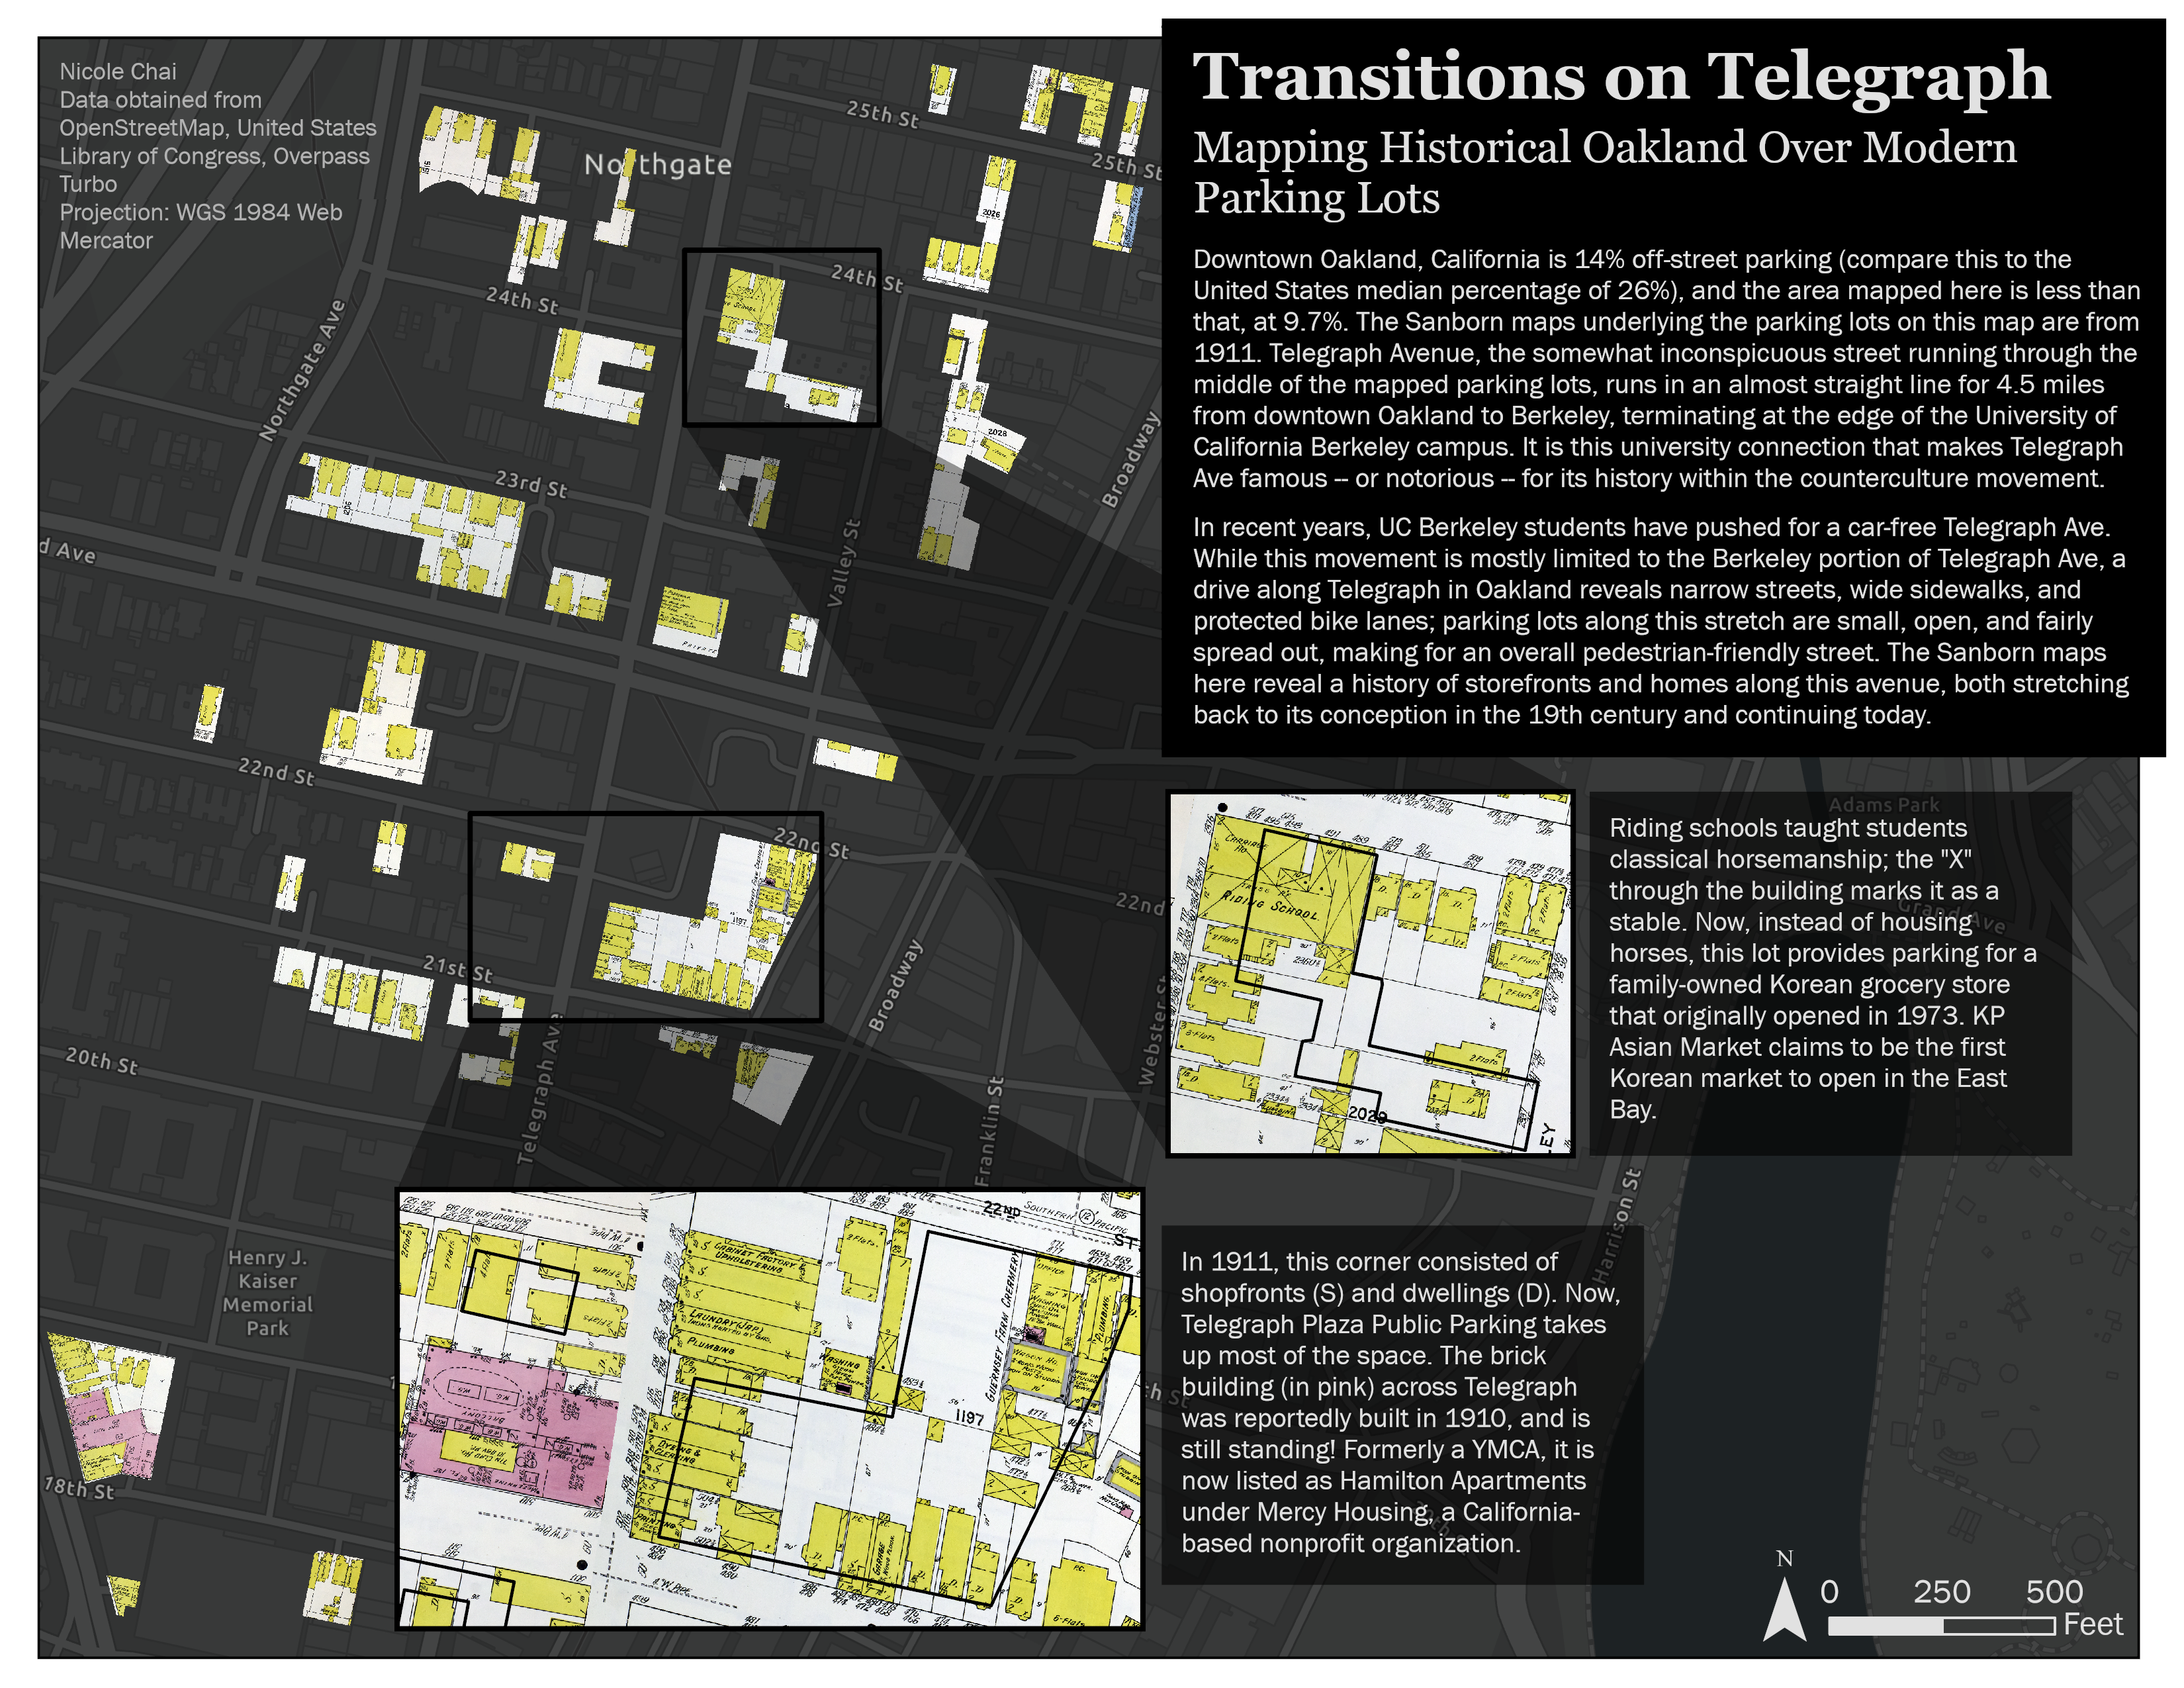
Using fire insurance and tax atlases like the ones displayed in the Leventhal Map & Education Center’s Atlascope tool, you will create a map of parking lot cemeteries.
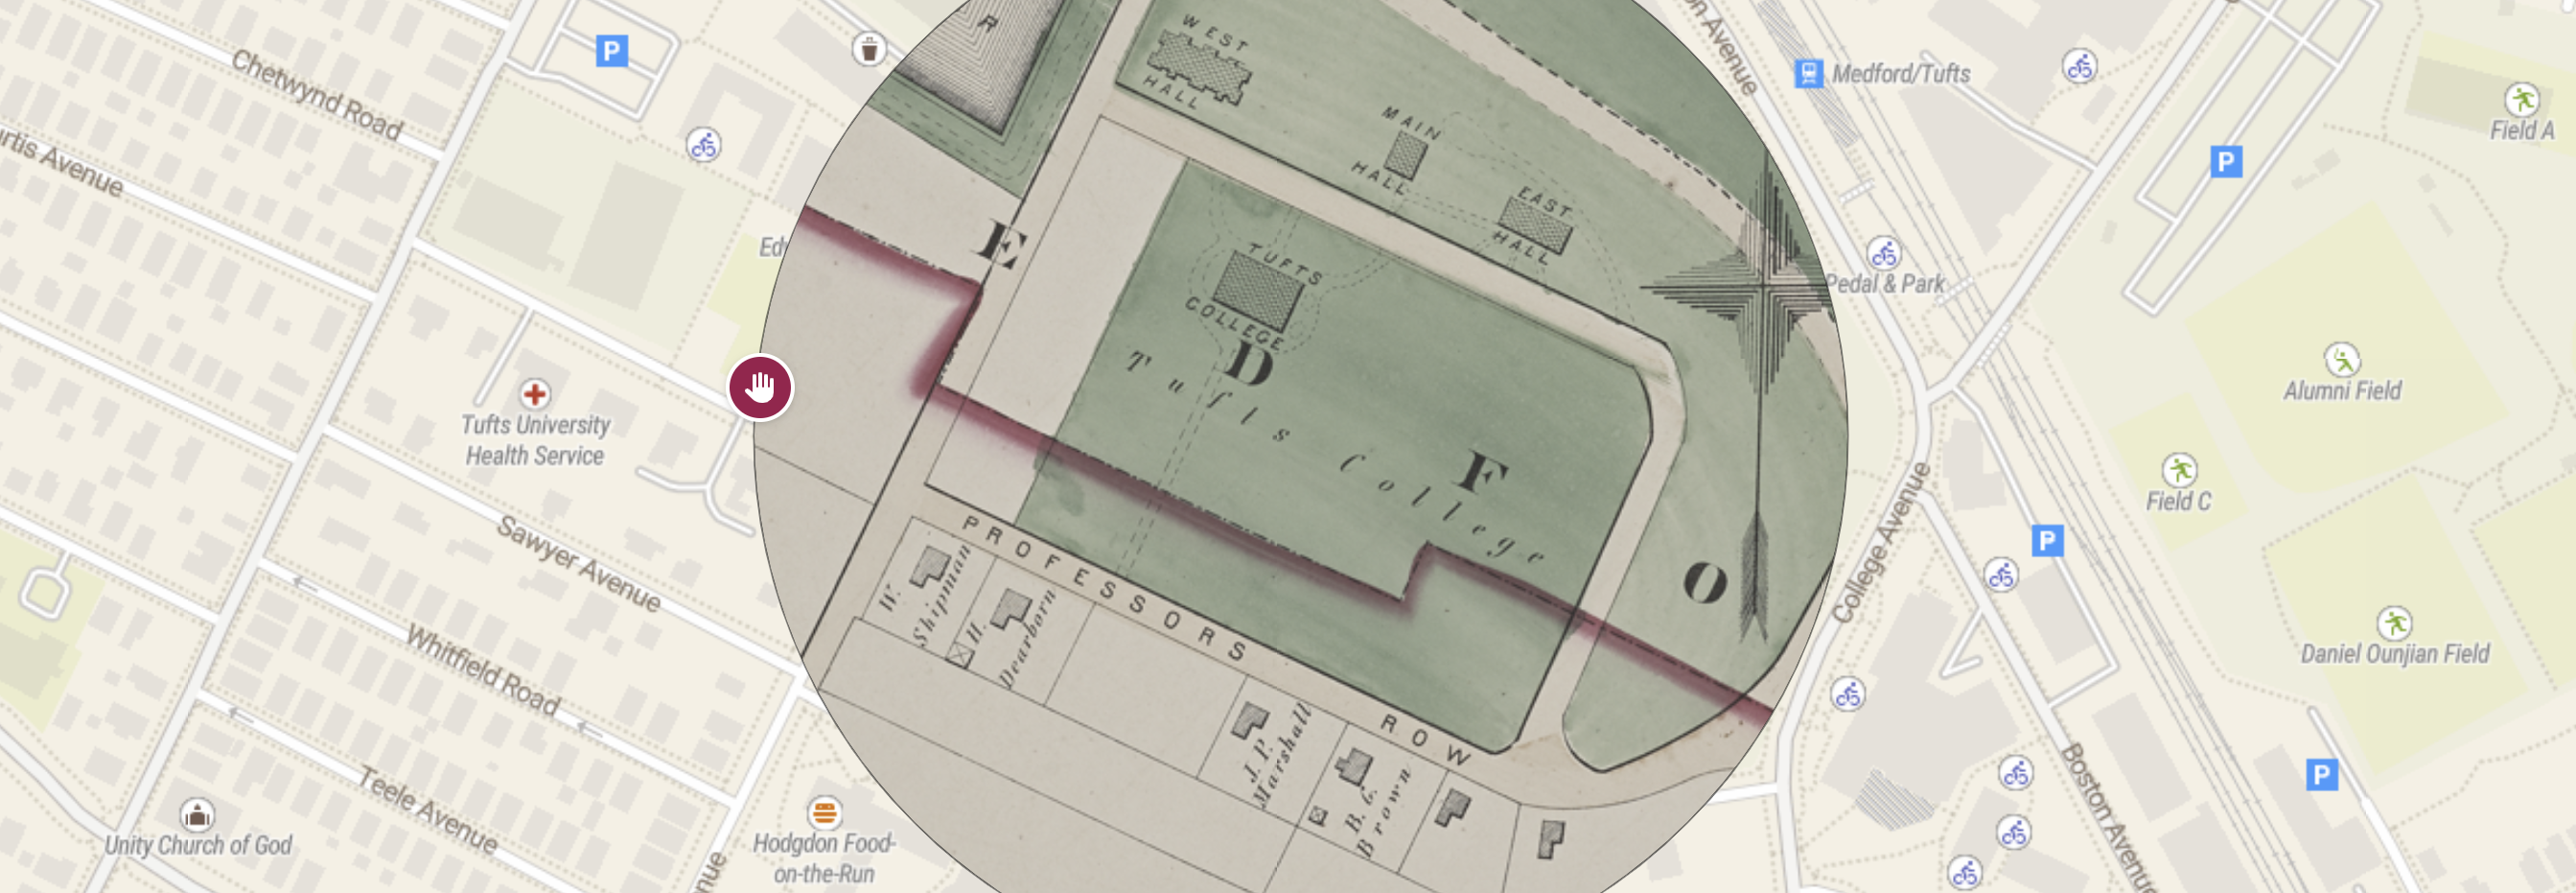
Fire insurance and tax atlases meticulously documented building material, street names, urban morphology, and much more, urban atlases provide detailed glimpses into how places have changed over time. Originally created so that banks could adequately assess fire insurance risk, today they are invaluable tools for historical urban research. The Sanborn Company produced by far the most maps of this genre in the United States. The Library of Congress holds nearly 700,000 Sanborn maps, with tens of thousands of atlases digitized in their entirety.
Your task is to choose a city in the United States—one with decent coverage of fire insurance atlases—and produce a map that answers two questions:
- What’s buried underneath modern-day parking lots?
- What percentage of land in my area of interest is devoted exclusively to parking?
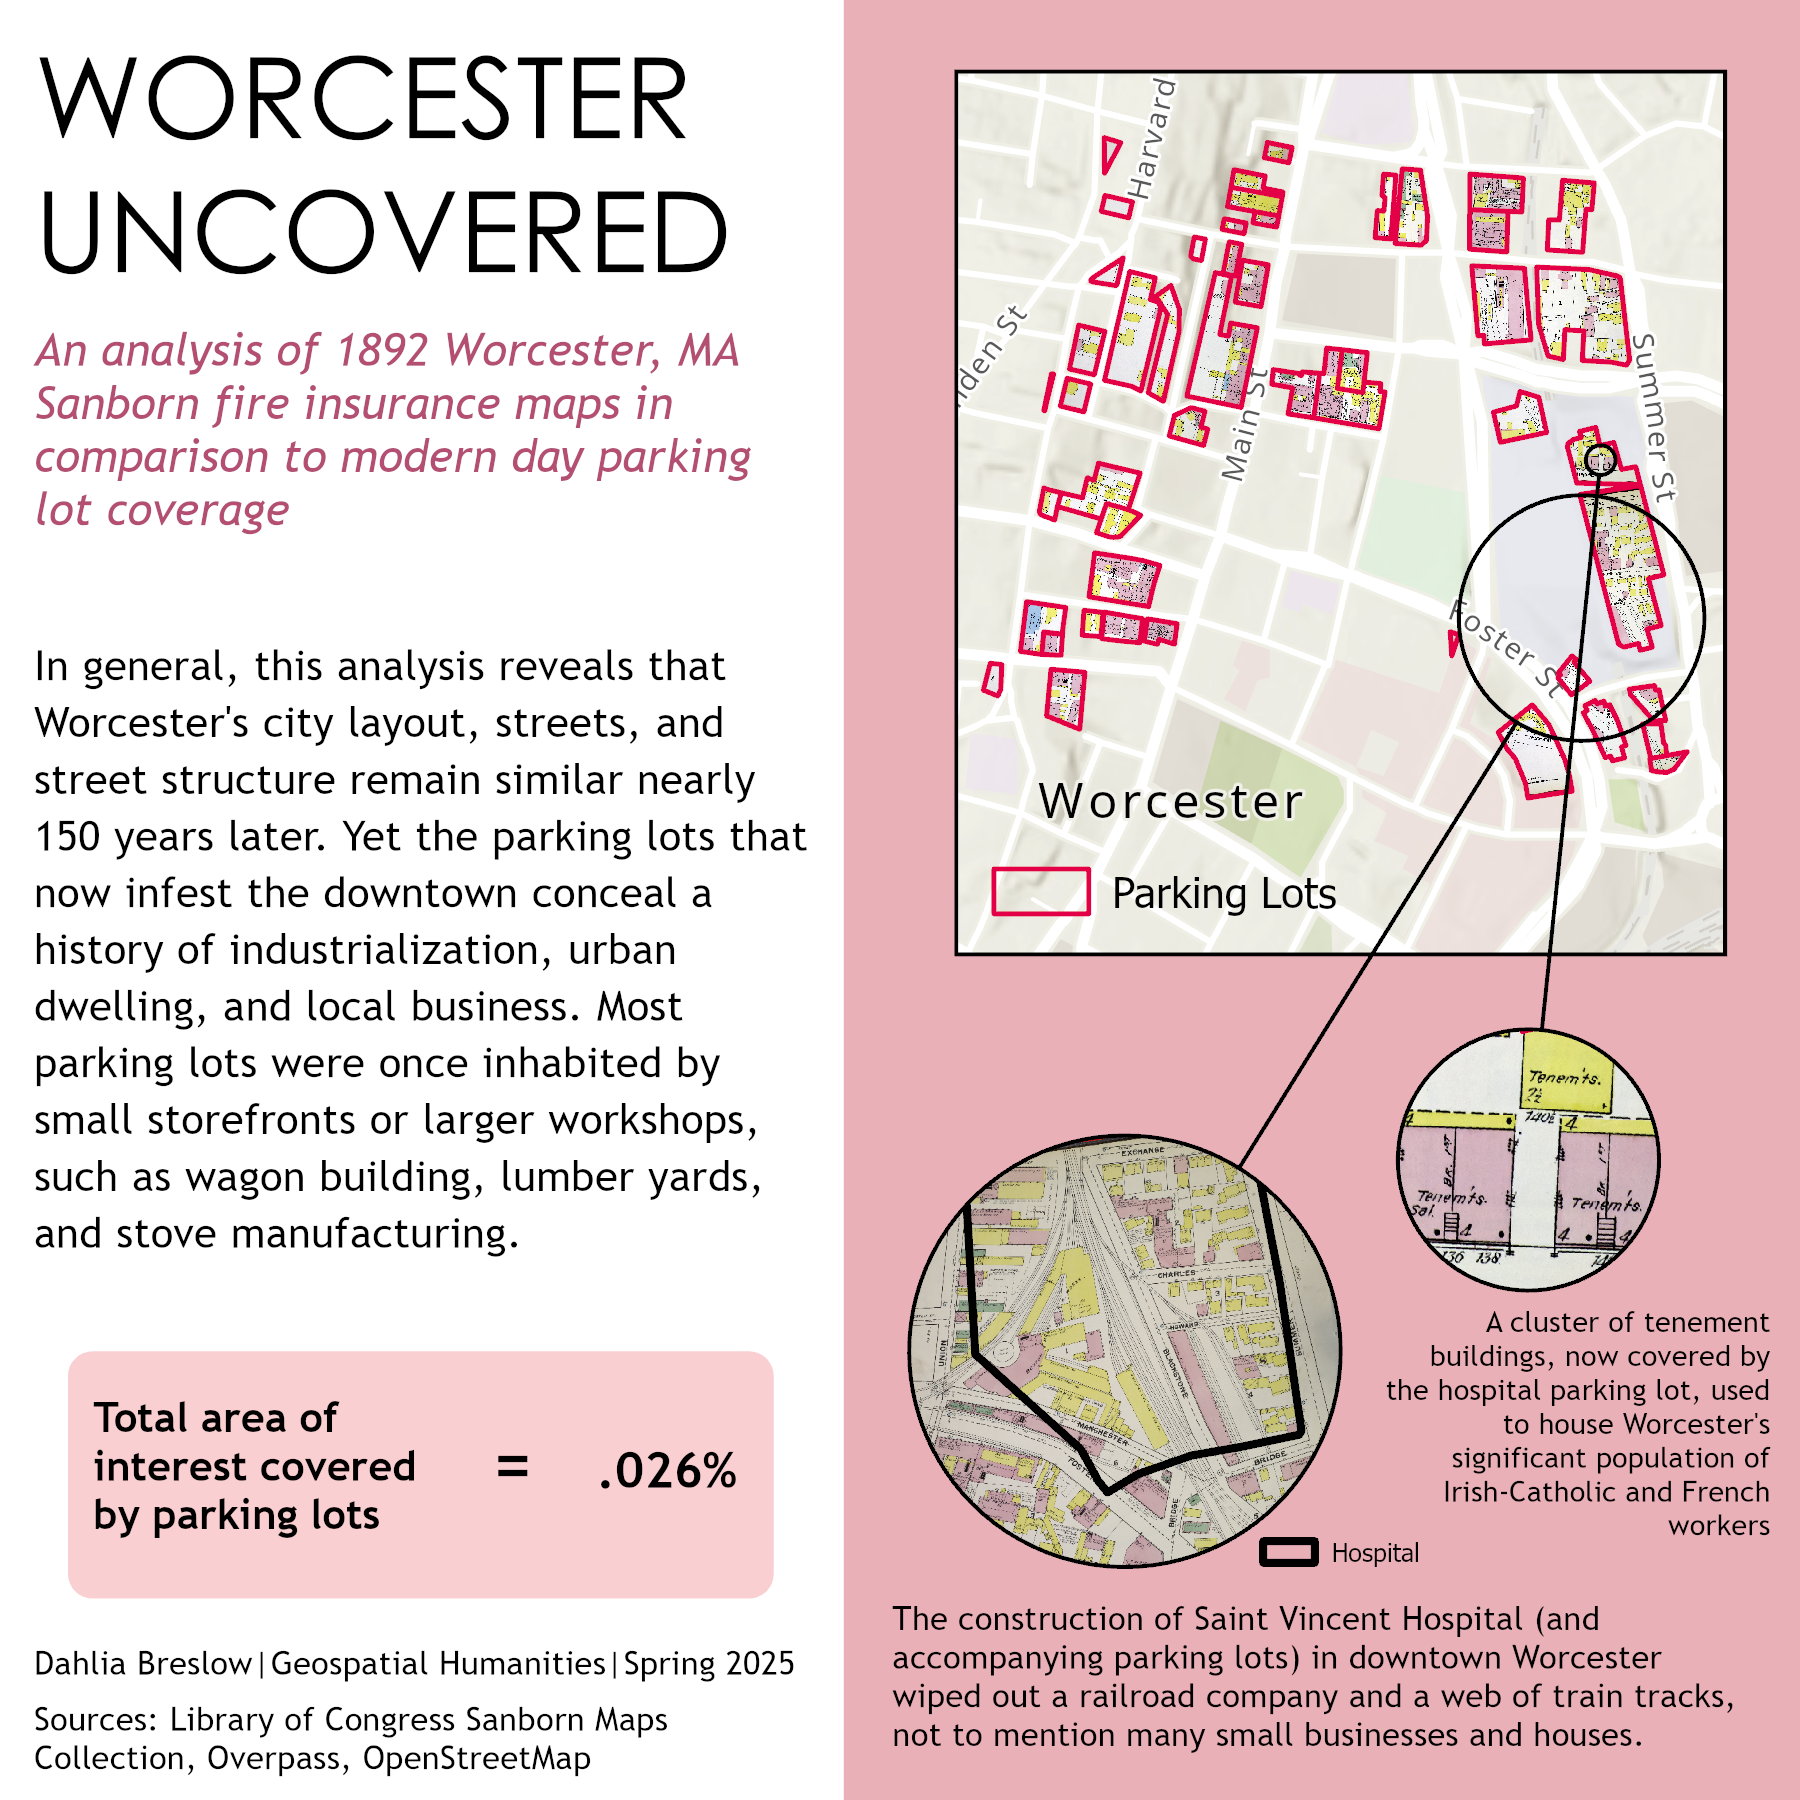
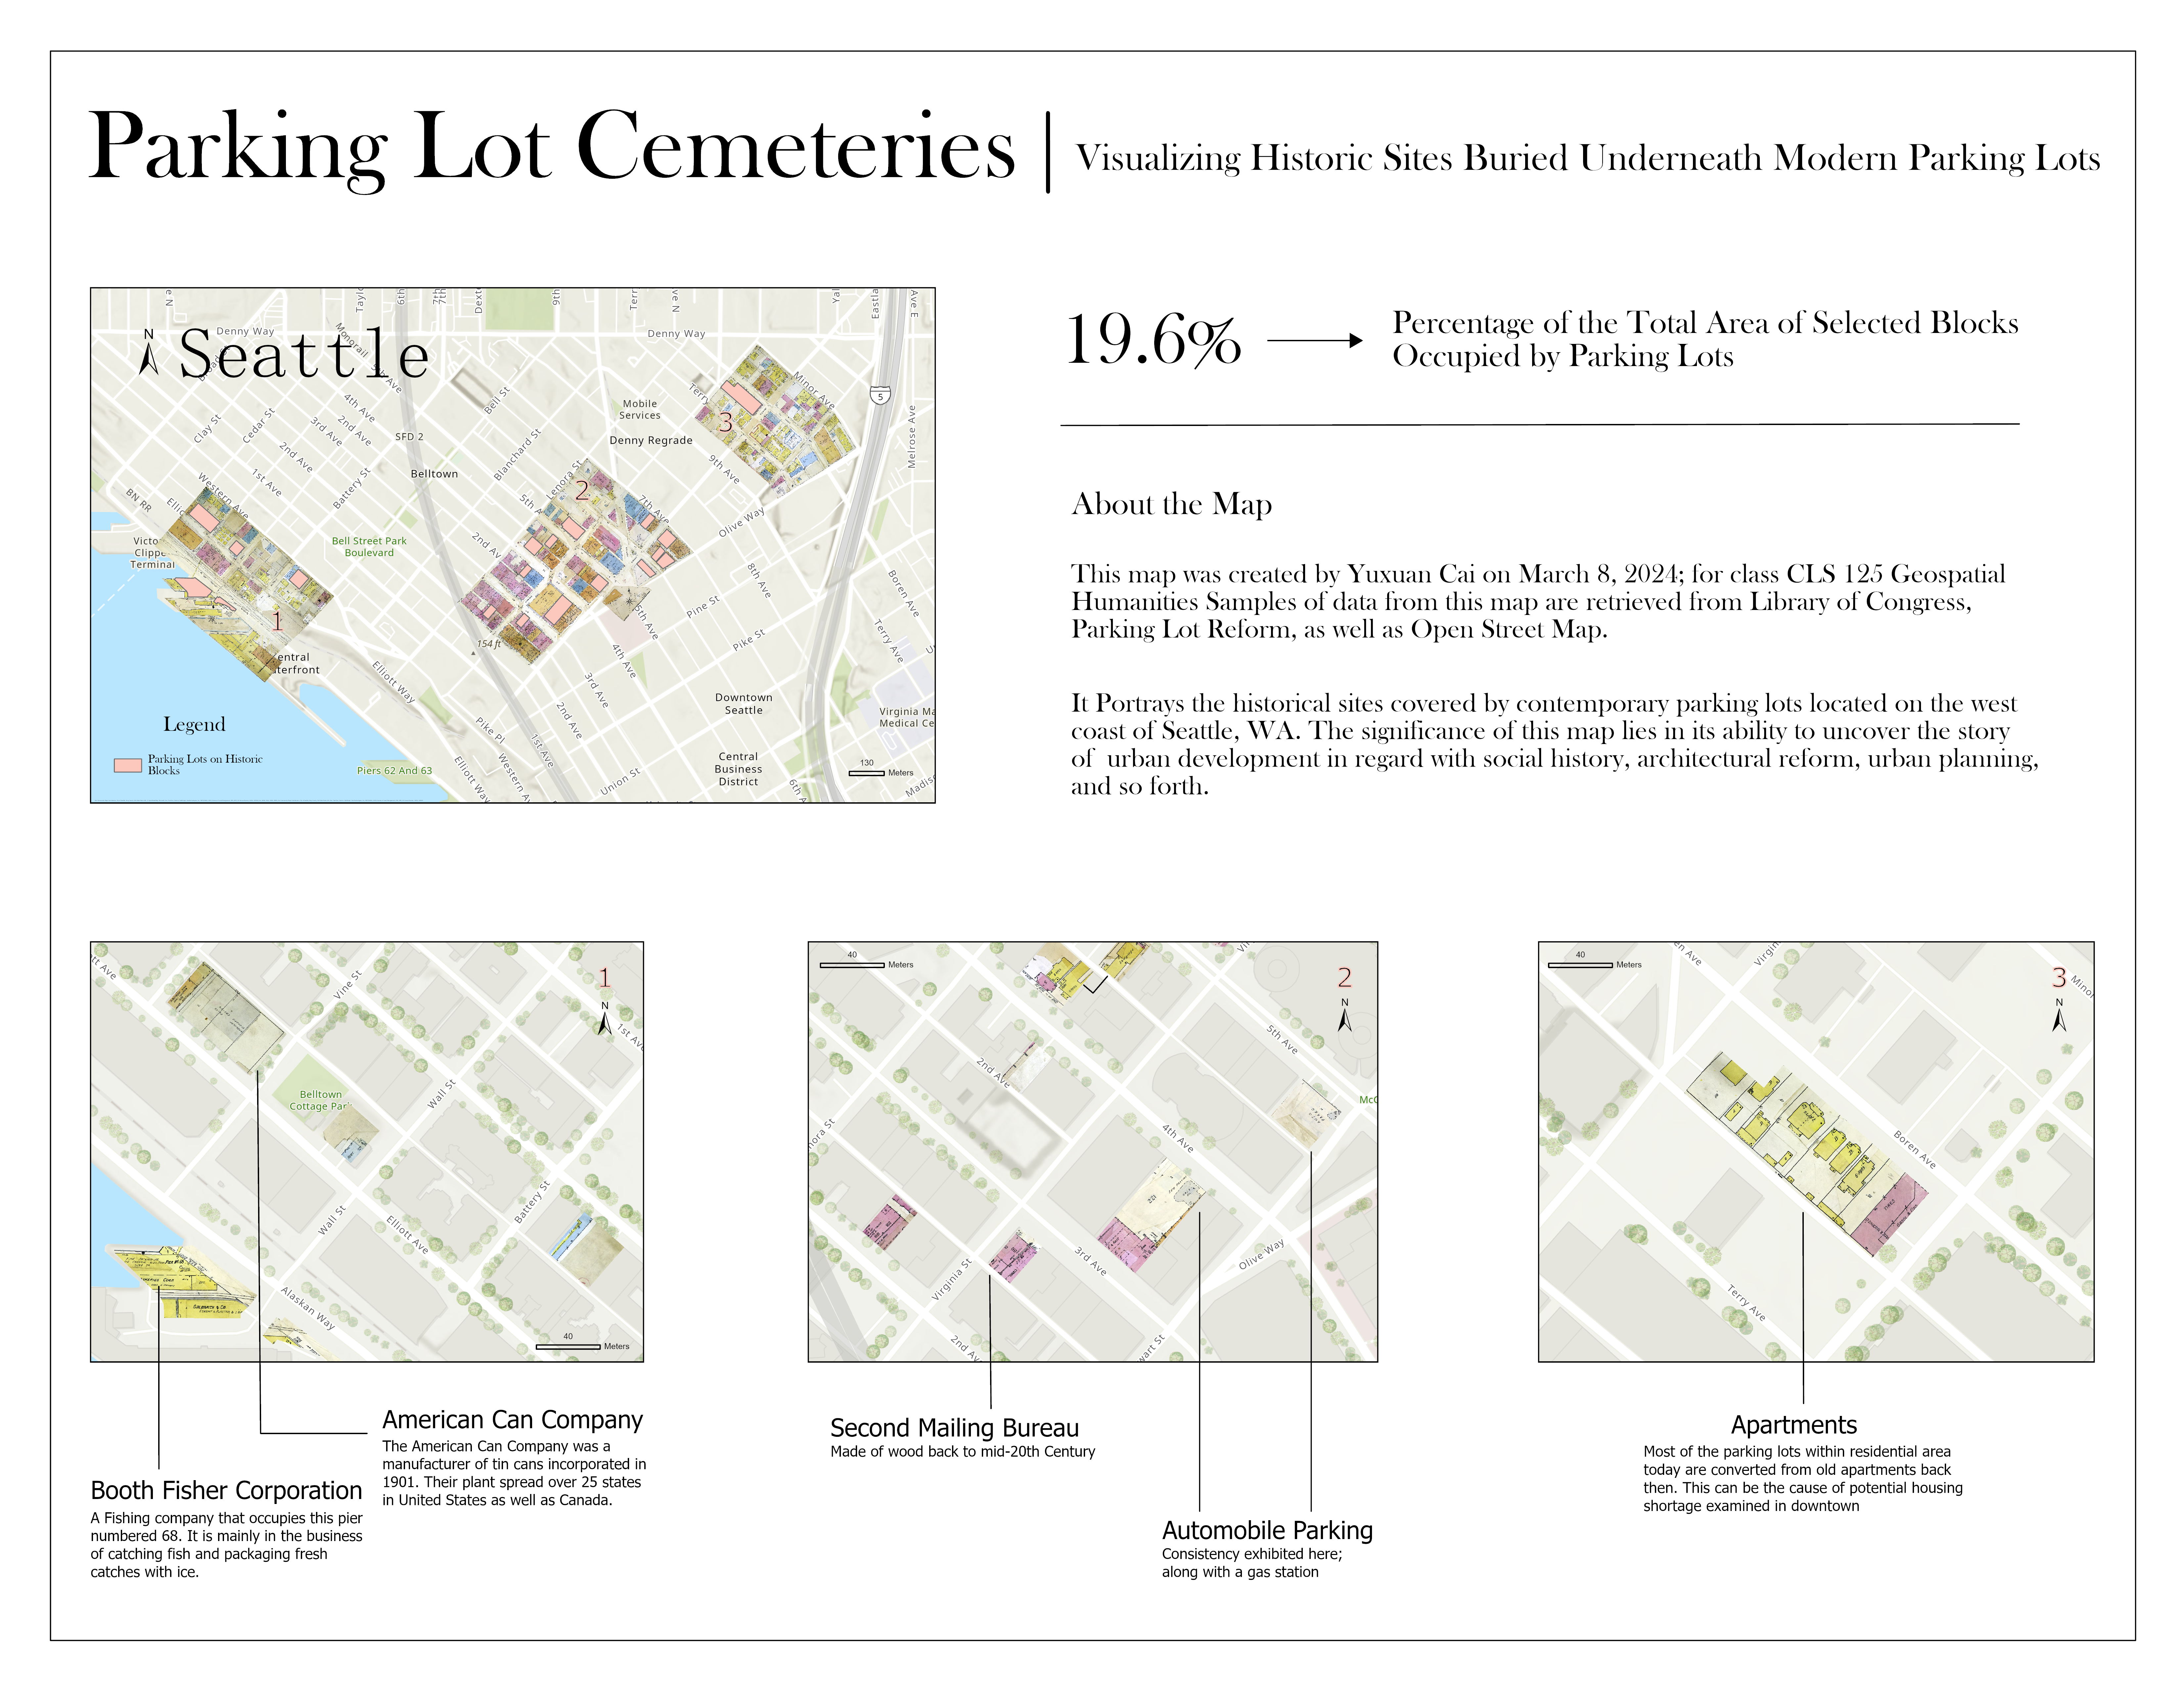
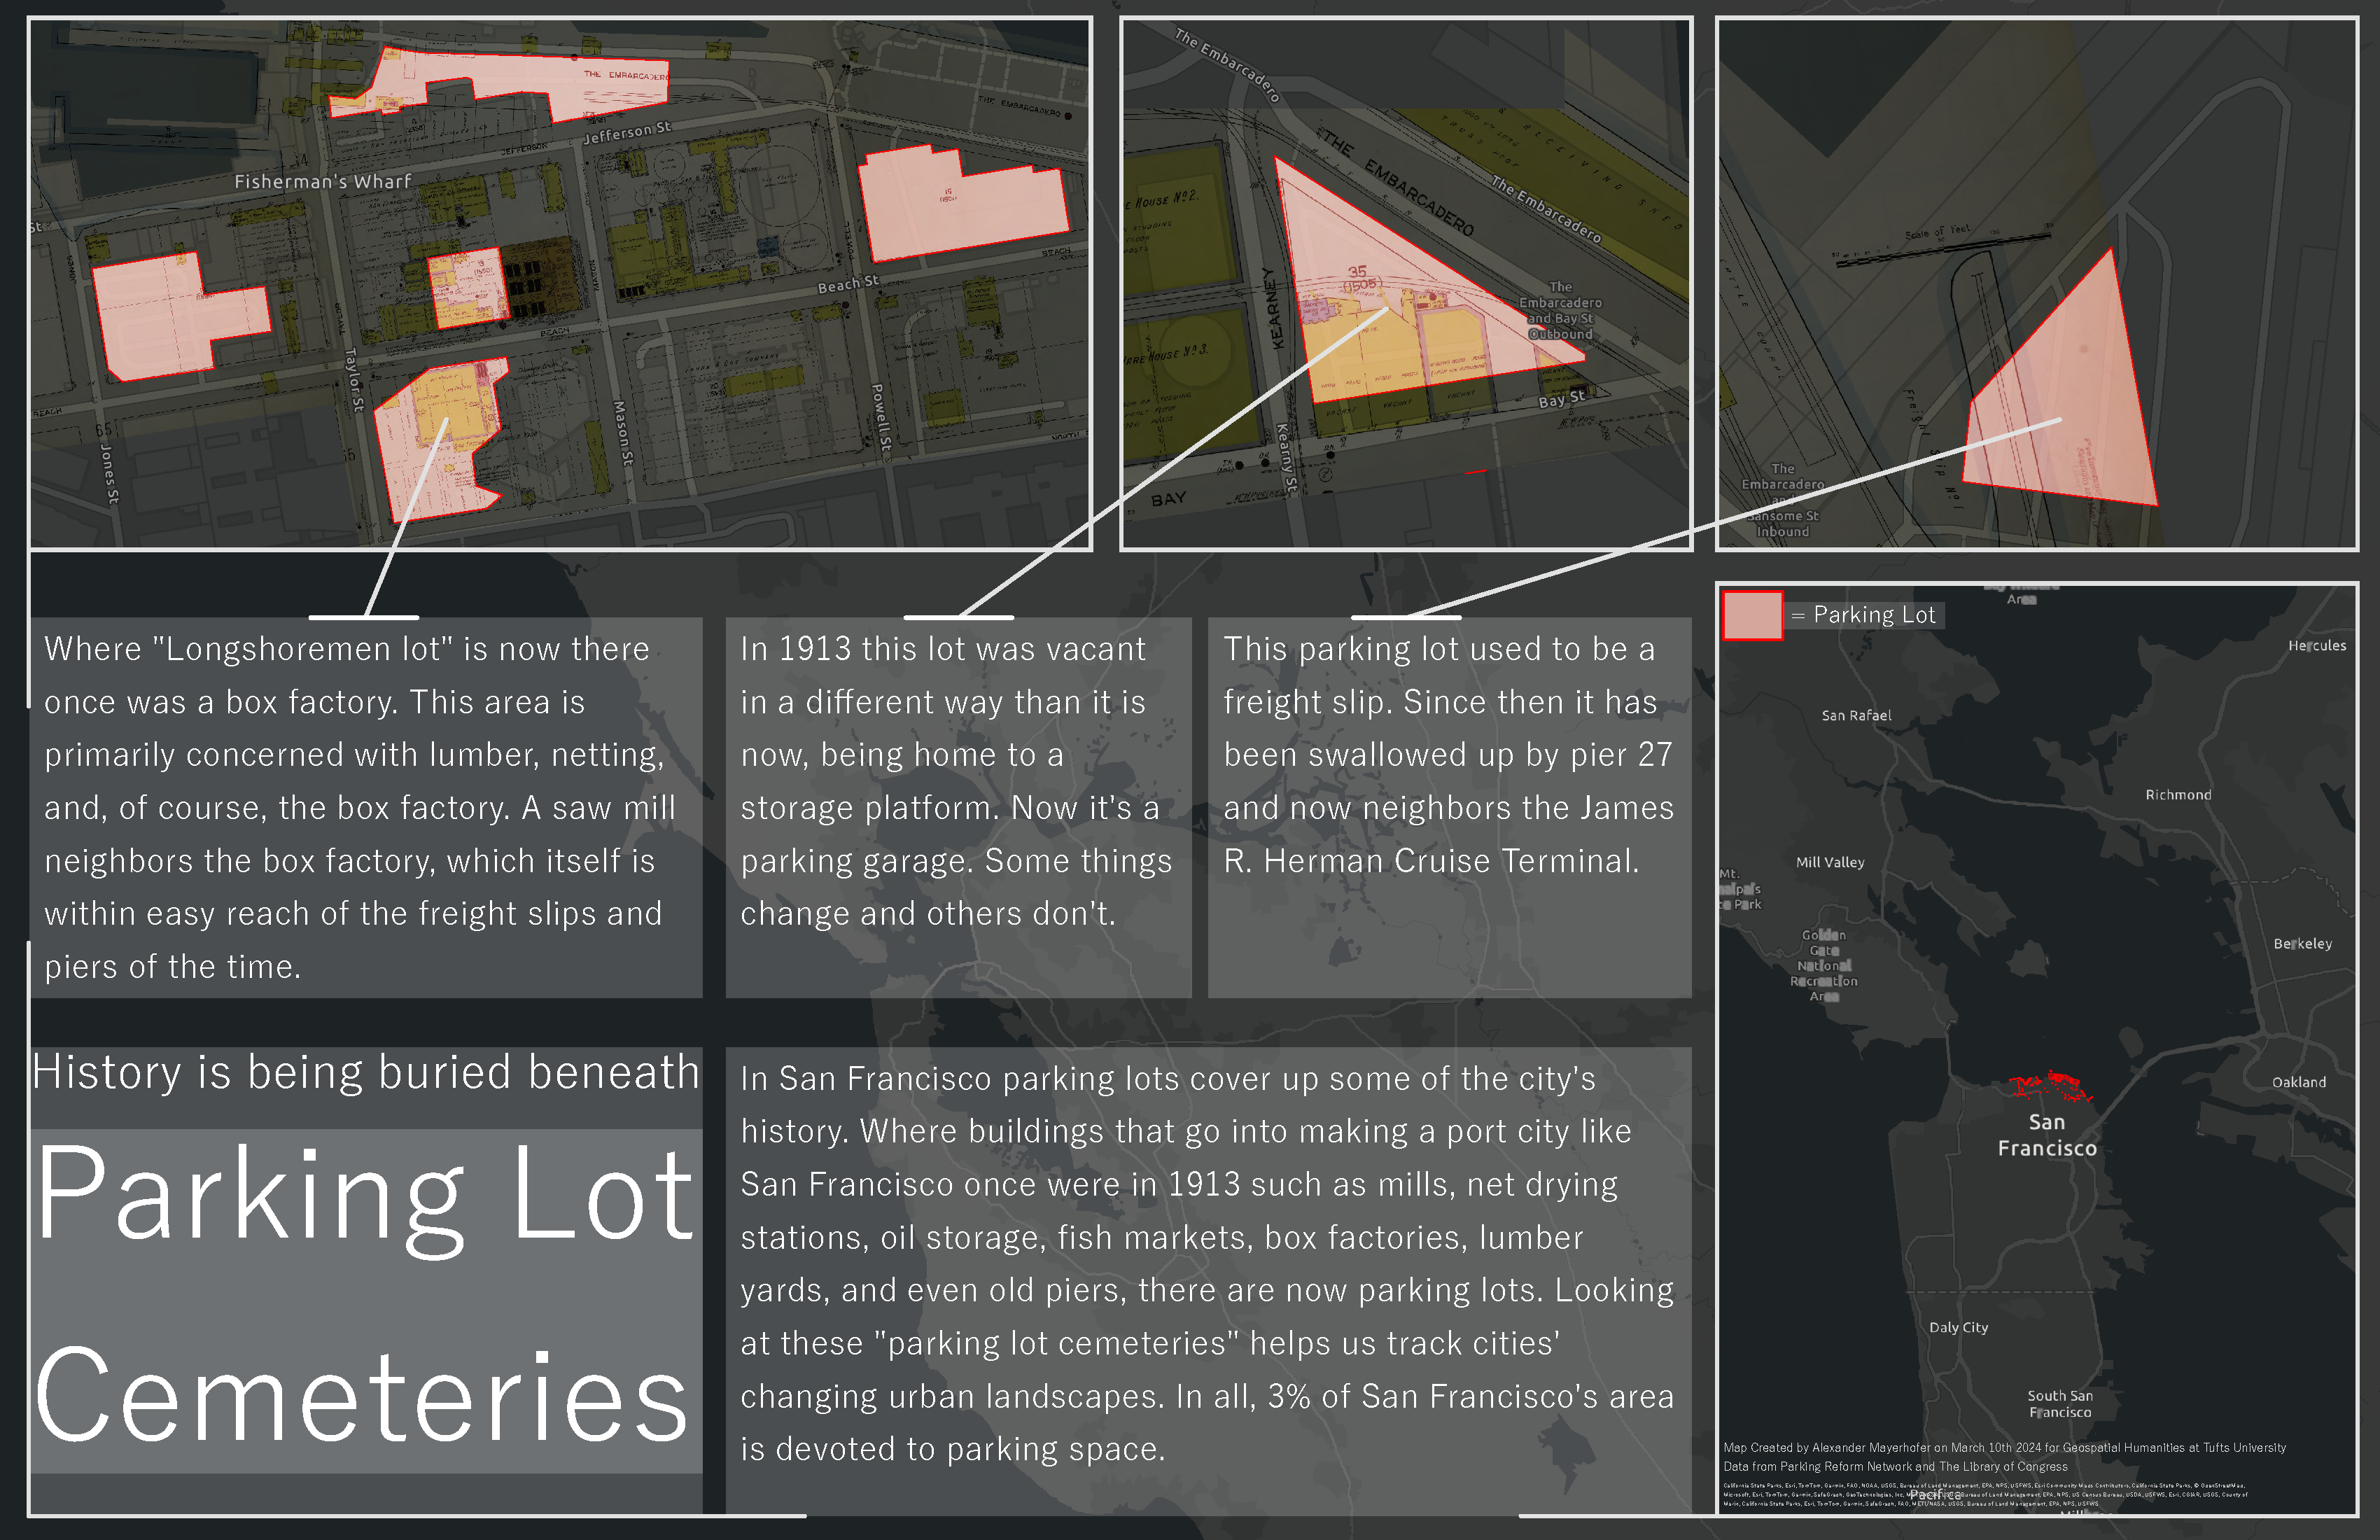
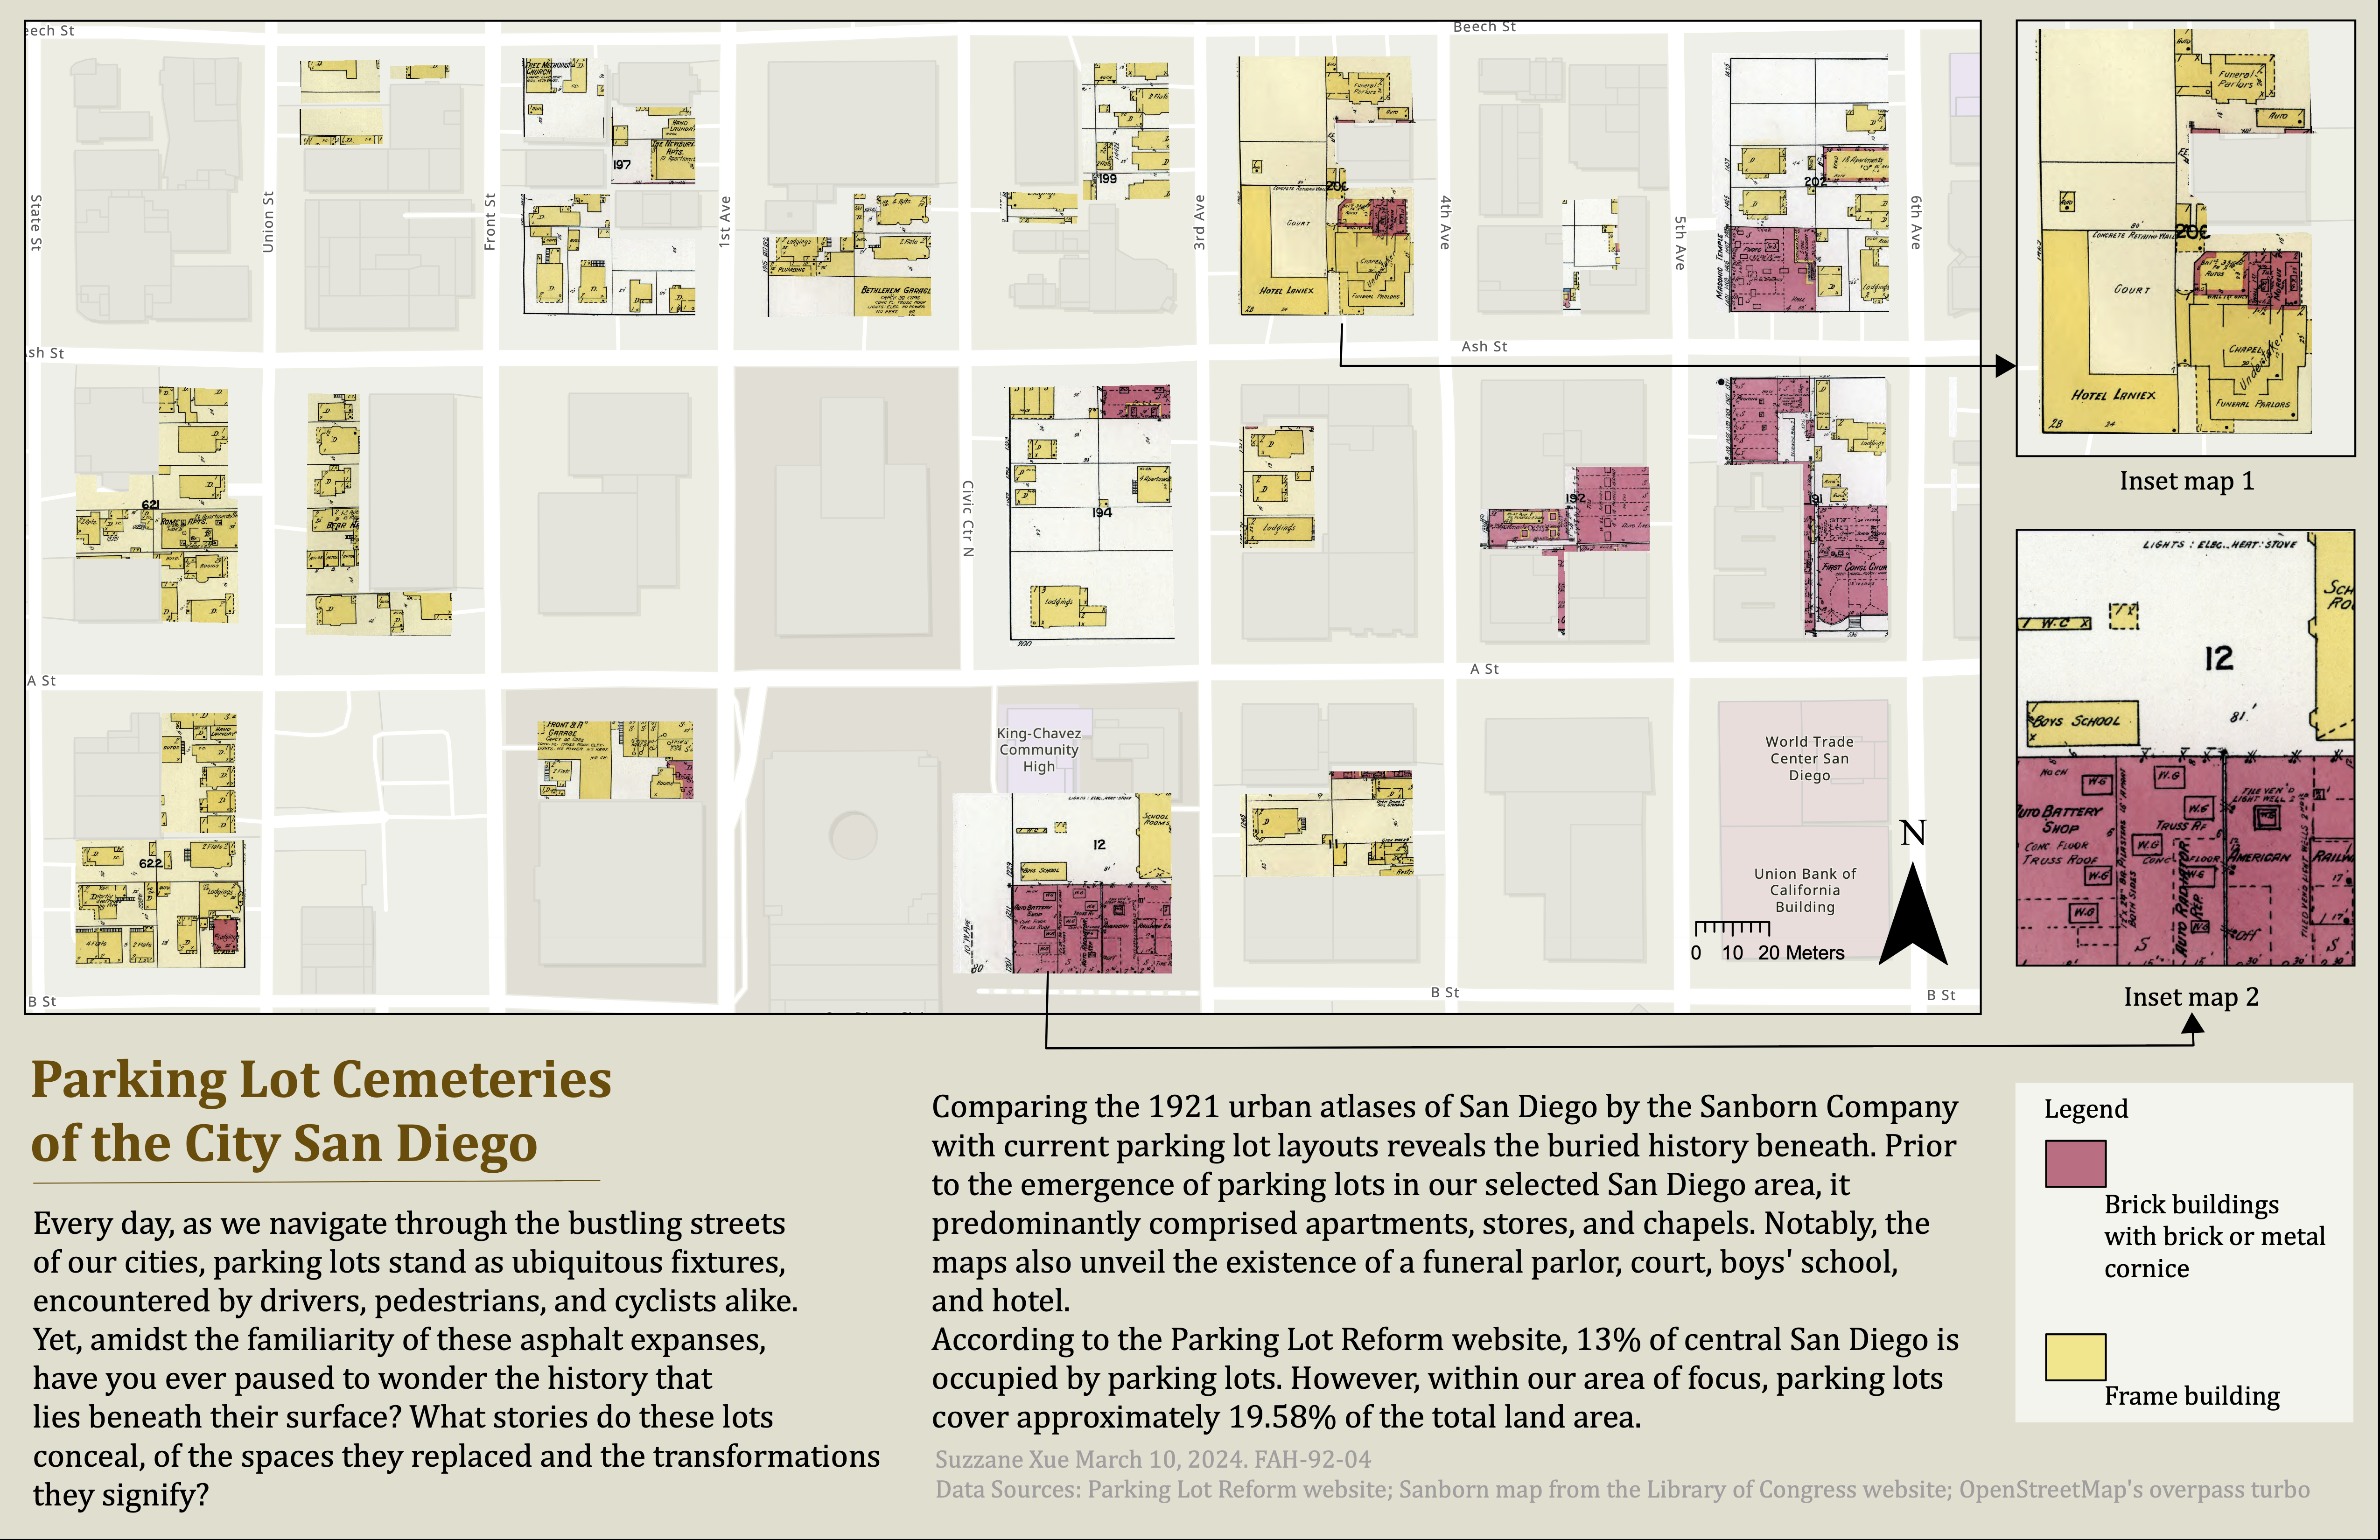
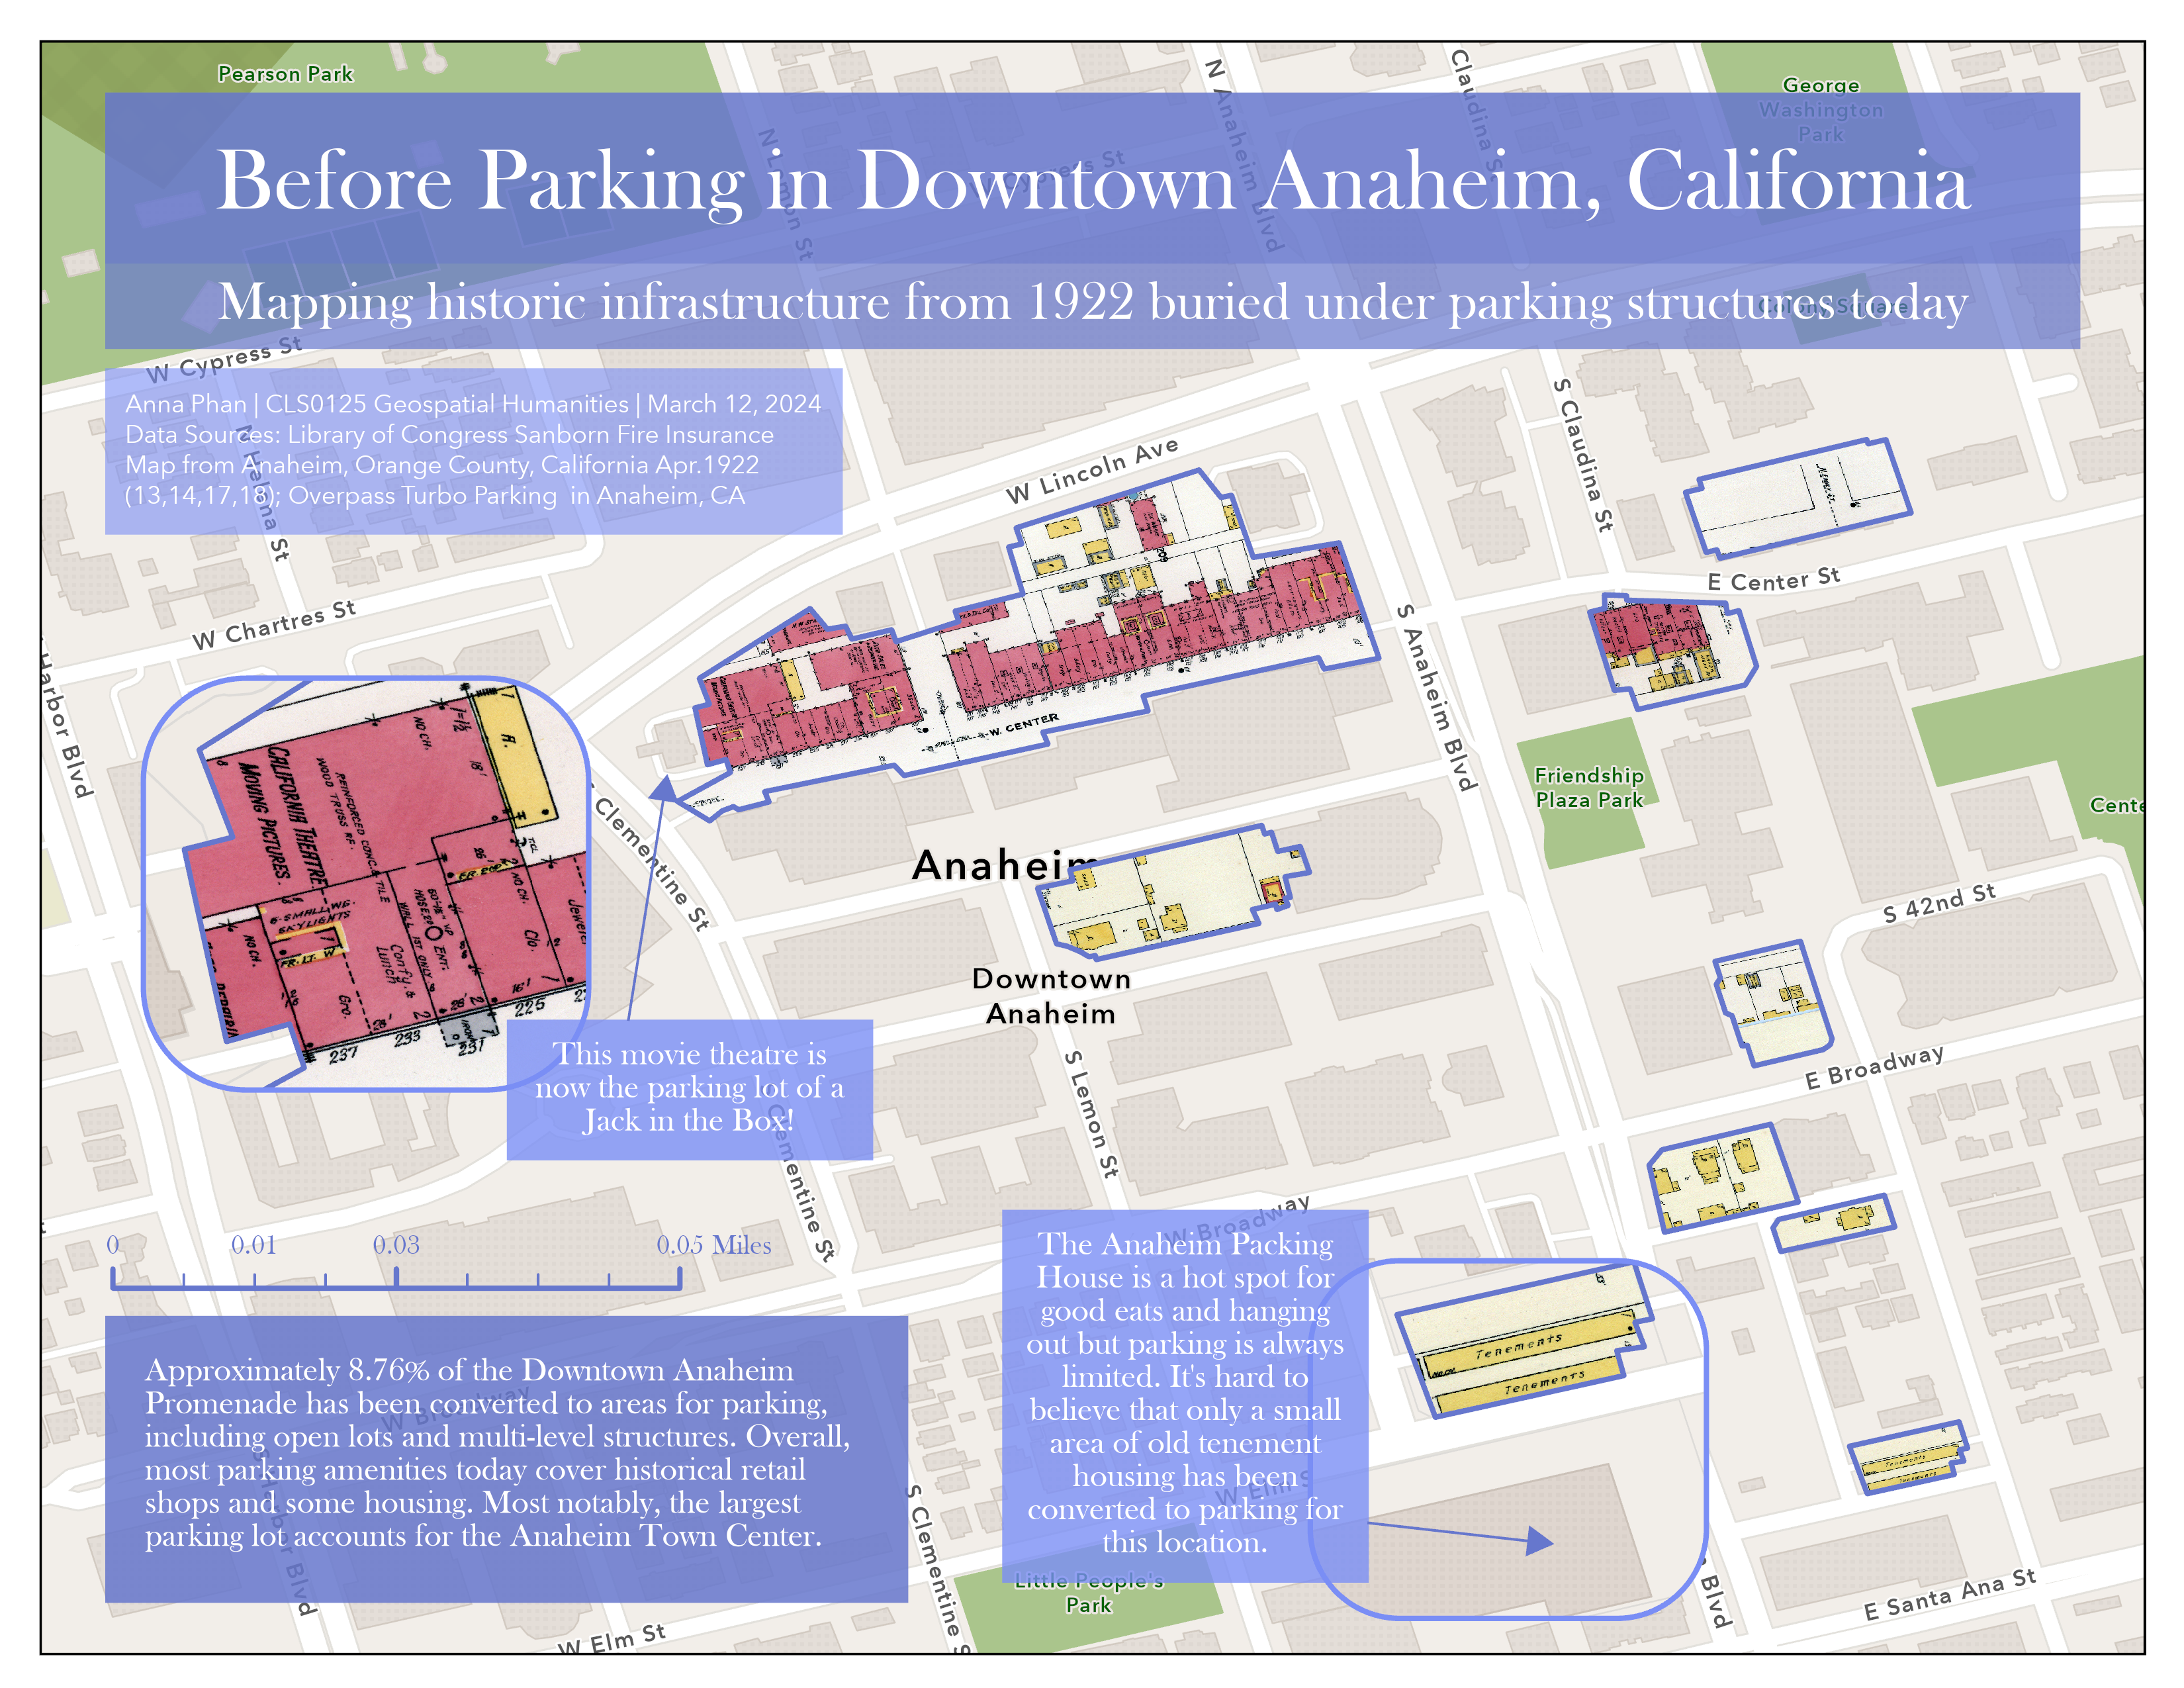
Example gallery
Here’s a sample of some excellent maps created in previous years:
Requirements
You’ll produce your final map using data from the following sources (see Table 1 for the components your final map should include):
- At least four georeferenced maps from the Library of Congress’ Sanborn map collection
- Parking lot vector data from OpenStreetMap, a volunteer-driven digital map and spatial database
| Component | Details |
|---|---|
| Cemeteries | A mosaicked layer of four georeferenced Sanborn atlases, clipped to parking lot data |
| Appropriate projection | See the note on projected coordinate systems below |
| Analysis | Include the percentage of total land area within your AOI occupied by parking lots (e.g., square meters of all parking lots / sq meters of city * 100) |
| Two inset maps | Zoom into your most interesting “parking lot cemeteries” |
| Accompanying text | Describe what’s buried underneath parking lots in general; describe your two most interesting “cemeteries” (may require extra research) |
| Design | Meaningful title, subtitle, data sources, cartographer info, and date; readable font; no unintentionally garish colors; good figure-ground sensibility; attention to contrast, layout, and balance |
You may use one of the preset “streaming” base maps from ArcGIS Pro for this assignment. You could still make your own base map (good practice, more fun!), but you don’t have to.
How to make your map
Georeferencing
Here’s a fork in the road: you can choose your own adventure for georeferencing.
- Option 1: Georeference using OldInsuranceMaps.net (must focus on Somerville)
- Option 2: Georeference using ArcGIS Pro (can pick any city in U.S.)
When you’re done georeferencing, and you’ve got at least 4 maps georeferenced, proceed to the next section.
You must georeference at least 4 maps for this assignment! You can do/use more if you want, but you’ve got to have a minimum of 4 georeferenced maps in your final submission.
Mask your GeoTIFFs
Now that you have at least 4 GeoTIFFs for your area, you can nicely mask and mosaic them.
Masking refers to the process of cropping away unwanted or non-cartographic features in the map. We accomplish this in ArcGIS Pro by creating a vector layer “mask,” and then clipping the georeferenced map to it.
There are a few ways to do this, but here’s how I would approach it:
- In your Catalog pane, right-click the
gdbfor this project. Select “New” => “Feature class” - Give it a name—I named mine
p1_mask, short for “Page 1 mask”—and click “Finish” - Now, you have a new vector layer in your Contents pane called
p1_mask—but it’s empty. Let’s draw a mask - Open the Edit tab in the Ribbon and click “Create”
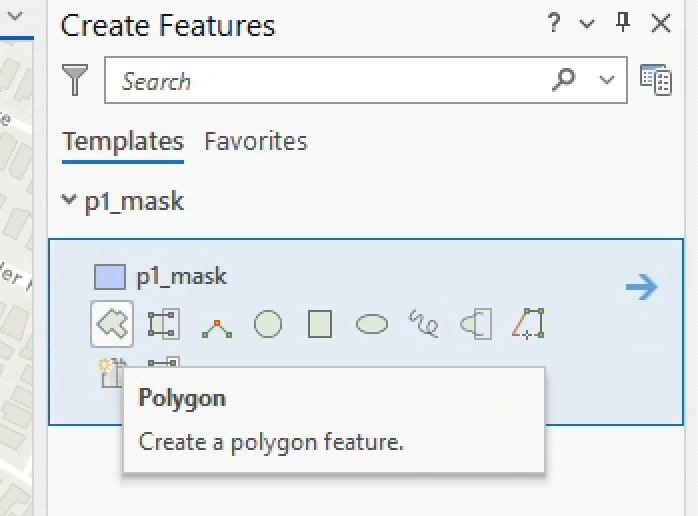
- This will open a “Create Features” pane on the right-hand side of the application
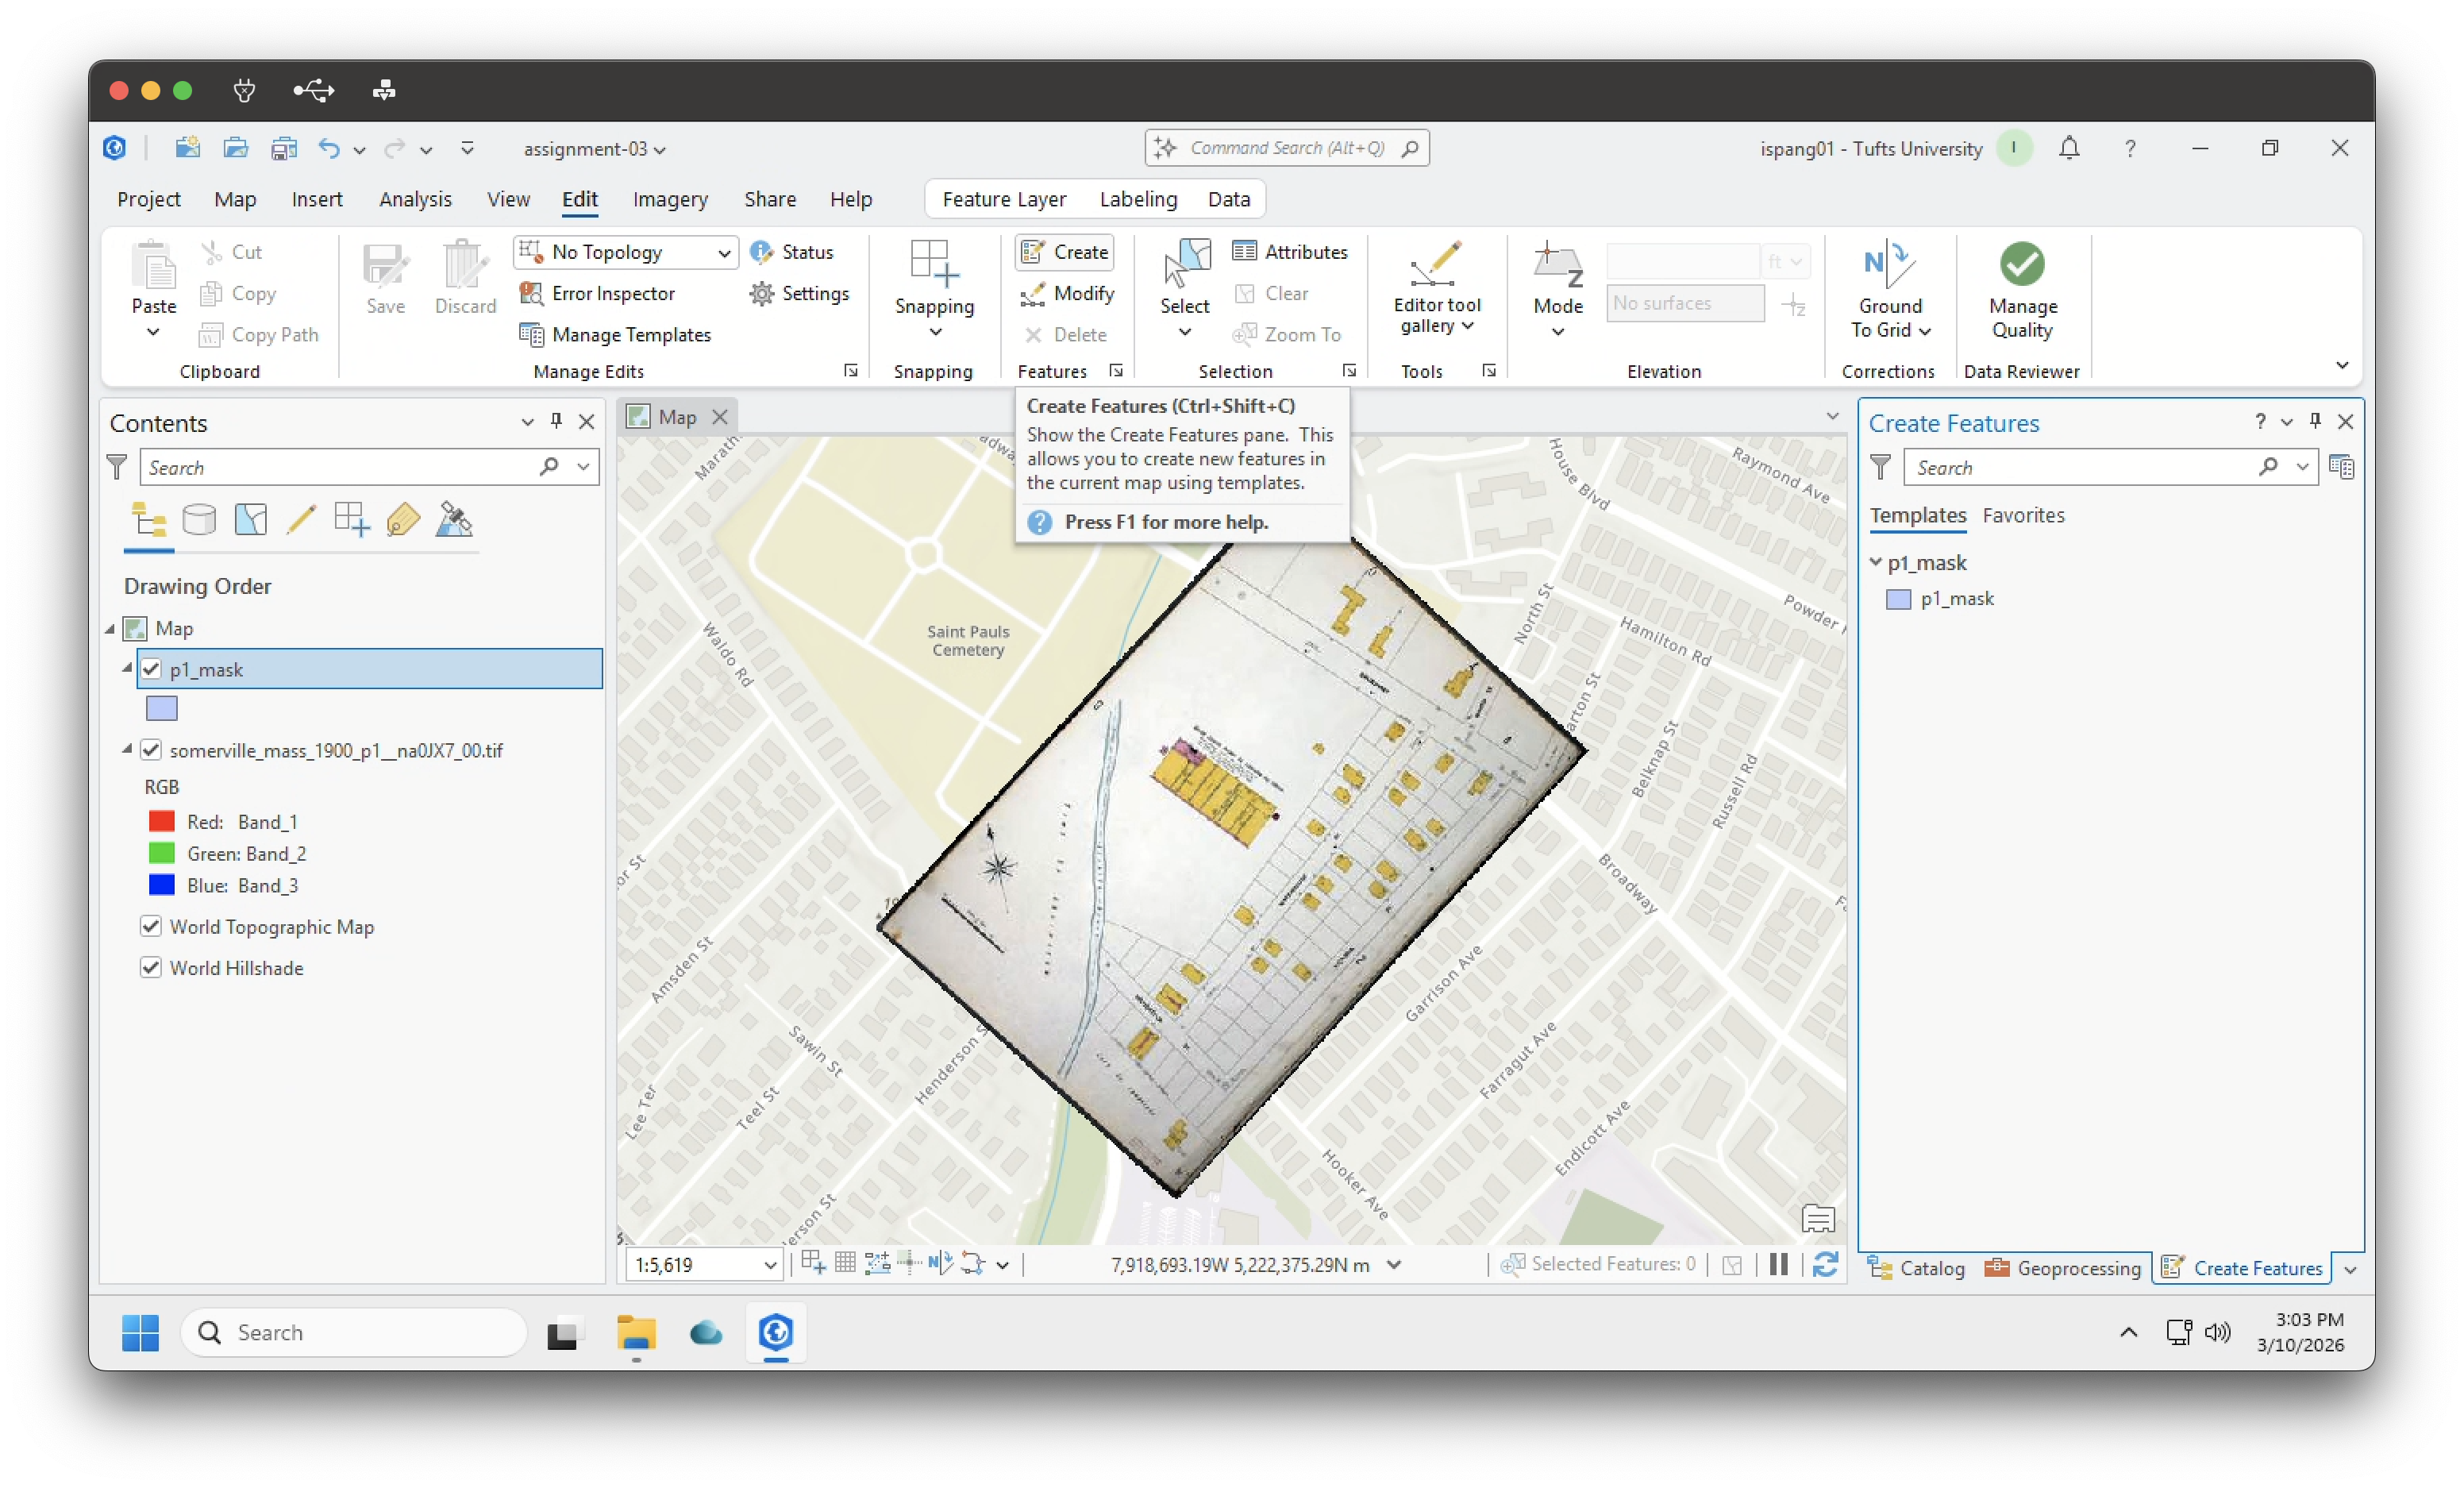
- Inside the “Create features” pane, click the
masklayer and select the polygon option
- Once it’s selected, you’re in “editing” mode and you can actually draw a polygon straight onto the map. You want to draw a mask that excludes the black edges of the georeferenced map without removing any important features. Watch the gif below for an example. Some notes:
- If you mess up, press the
escapebutton and that should reset your points - You can pan the map by clicking down the scroll-wheel
- To finish drawing your polygon, simply double-click
- If you mess up, press the
- When you’re pleased with your mask, make sure you click “Save” in the Edit tab of the Ribbon!
- Now, let’s clip that georeferenced map to the new vector mask. Search “clip raster” in the Command search bar—you should see an option for “Clip Raster (Data Management Tools)”. Go ahead and select that tool
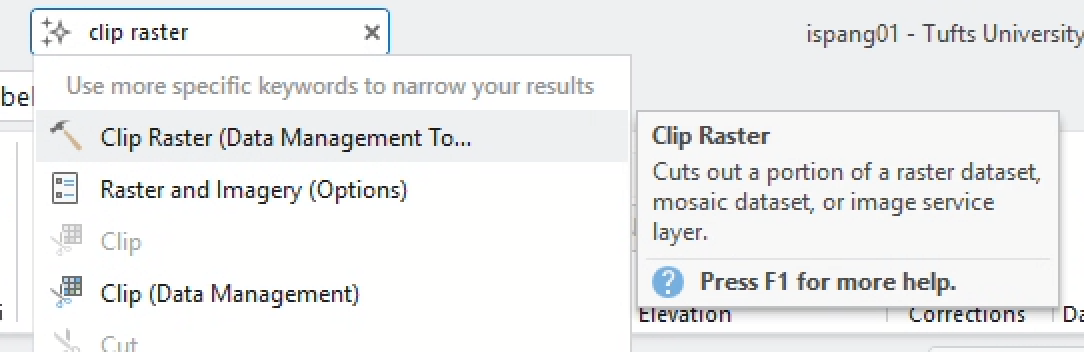
- Set the parameters in the “Clip Raster” tool to:
- Input raster: Your georeferenced map
- Output extent: Your mask (the feature should be selected and you should choose “Use the selected records”)
- Output raster dataset: save this to your
gdbwith name like “p1_masked” - Make sure the “Use input features for clipping extent” box is checked!!
- Click “Run”
When it finishes runing, you should have a nicely “masked” map layer, like this:
Now, repeat this process for each map you have selected.
Mosaic your masked maps
This one should be pretty easy… just one tool!
Using your georeferenced, masked maps as the inputs, mosaic the plates into a single layer.
Be sure to generate a footprint of the mosaicked raster when you run the tool! You’ll use this later.
Get parking lot data
Okay, you now have at least four maps that have been georeferenced, masked, and mosaicked: nice!
It’s time to overlay these historic maps with modern-day parking lots. We can get the data from OpenStreetMap, a massive, open-source, crowdsourced digital mapping project.
You can’t download parking lot data directly from OSM, but you can use another tool called overpass turbo. overpass turbo makes it possible to download a geojson file of parking lots in your area of interest from OpenStreetMap.
Open overpass turbo, and copy and paste the following query into its query builder:
way
    [amenity=parking]
    ({{bbox}});
(._;>;);
out;
Then, navigate to your area of interest on the map itself. By “area of interest,” I mean an area that is roughly equivalent to the extent of the Sanborn maps that you georeferenced. Make sure that the screen is zoomed in to such an extent that your entire area of interest is visible, but not so zoomed out that you end up retrieving a ton of extra data.
Click Run, then click Export ➡️ download the GeoJSON
- Convert the GeoJSON to a feature class and load it into your map (While you’re doing this, you might opt to remove all the fields that come down from overpass turbo. You won’t need them)
- Raster clip mosaicked maps by parking lots (you might need to fiddle with the checkboxes in the tool options to get this to work!)
- If not already present, calculate geometry for both your parking lot and footprint layers. Then, using the Field Calculator, compute how much of the area of interest is occupied by parking lots today, and include that value somewhere in your map
Once you’re done with the above steps, spend some time examining the parking lot cemeteries. Are there any patterns that you notice between what used to exist? What did the land underneath parking lots used to contain?
Layout
Now, just lay out your final map in ArcGIS Pro (or your preferred layout software). Check out the example maps above for inspiration.
Submit
Congratulations—now you too are a grave-maker! Just don’t forget to submit your final map.
| Assigned | Due | Submit |
|---|---|---|
Mar 10, 2026 |
Mar 24, 2026 |