Lab 03
Lighthouses, shipwrecks, and empire
| Assigned | Due | Submit |
|---|---|---|
Mar 3, 2026 |
Mar 12, 2026 |
Introduction and context
In the mid-1720s, an English carpenter and self-taught horologist named John Harrison puzzled out the “longitude problem,” effectively making it possible to determine the precise location of a ship at sea. This technical innovation would foreshadow two-hundred years during which the British Navy enjoyed near hegemonic power over the maritime world. They enforced this missive to “rule the waves,” as it were, through a combination of hard and soft power known as “gunboat diplomacy” (Spence 2015):
“The Royal Navy was a key psychological weapon to sway sovereign states into signing deals weighted towards British commerce and strategy. This tactic would become known as ‘gunboat diplomacy,’ and it was built upon the impressions of British prestige which allowed the Royal Navy to wield both the carrot and the stick of intimidation and friendship.”
Between the 17th century and early 19th centuries, the British Navy also acted as “the handmaiden of the slave trade.” When the passage of the Slave Trade Act in 1807 reversed the Navy’s course and ushered in an era of anti-slavery, they continued to reap material and geopolitical benefits in the form of establishing British imperial influence in Zanzibar, for example, or “liberating” the captives of slaving ships into fourteen-year long “apprentice programs” that were, essentially, systems of indentured servitude.
Clearly, the Royal Navy guarded British imperial interests at home and abroad, but who—or rather, what—guarded the Royal Navy?

From Virginia Woolf to Robert Eggers, lighthouses are regarded as the stuff of symbolism. Former commissioner of the U.S. lighthouse service George Rockwell Putnam once said that lighthouses “appeal to the interest and better instinct of man because they are symbolic of never-ceasing watchfulness, of steadfast endurance in every exposure, of widespread helpfulness” (Putnam 1917).
Perhaps they do. In a very real sense, however, these beacons of watchfulness also constituted the architecture of the Britain’s maritime empire. By signaling areas for ships to avoid, they ensured that the British fleet could safely traverse a maritime landscape full of dangerous shoals and reefs and arrive home unscathed.
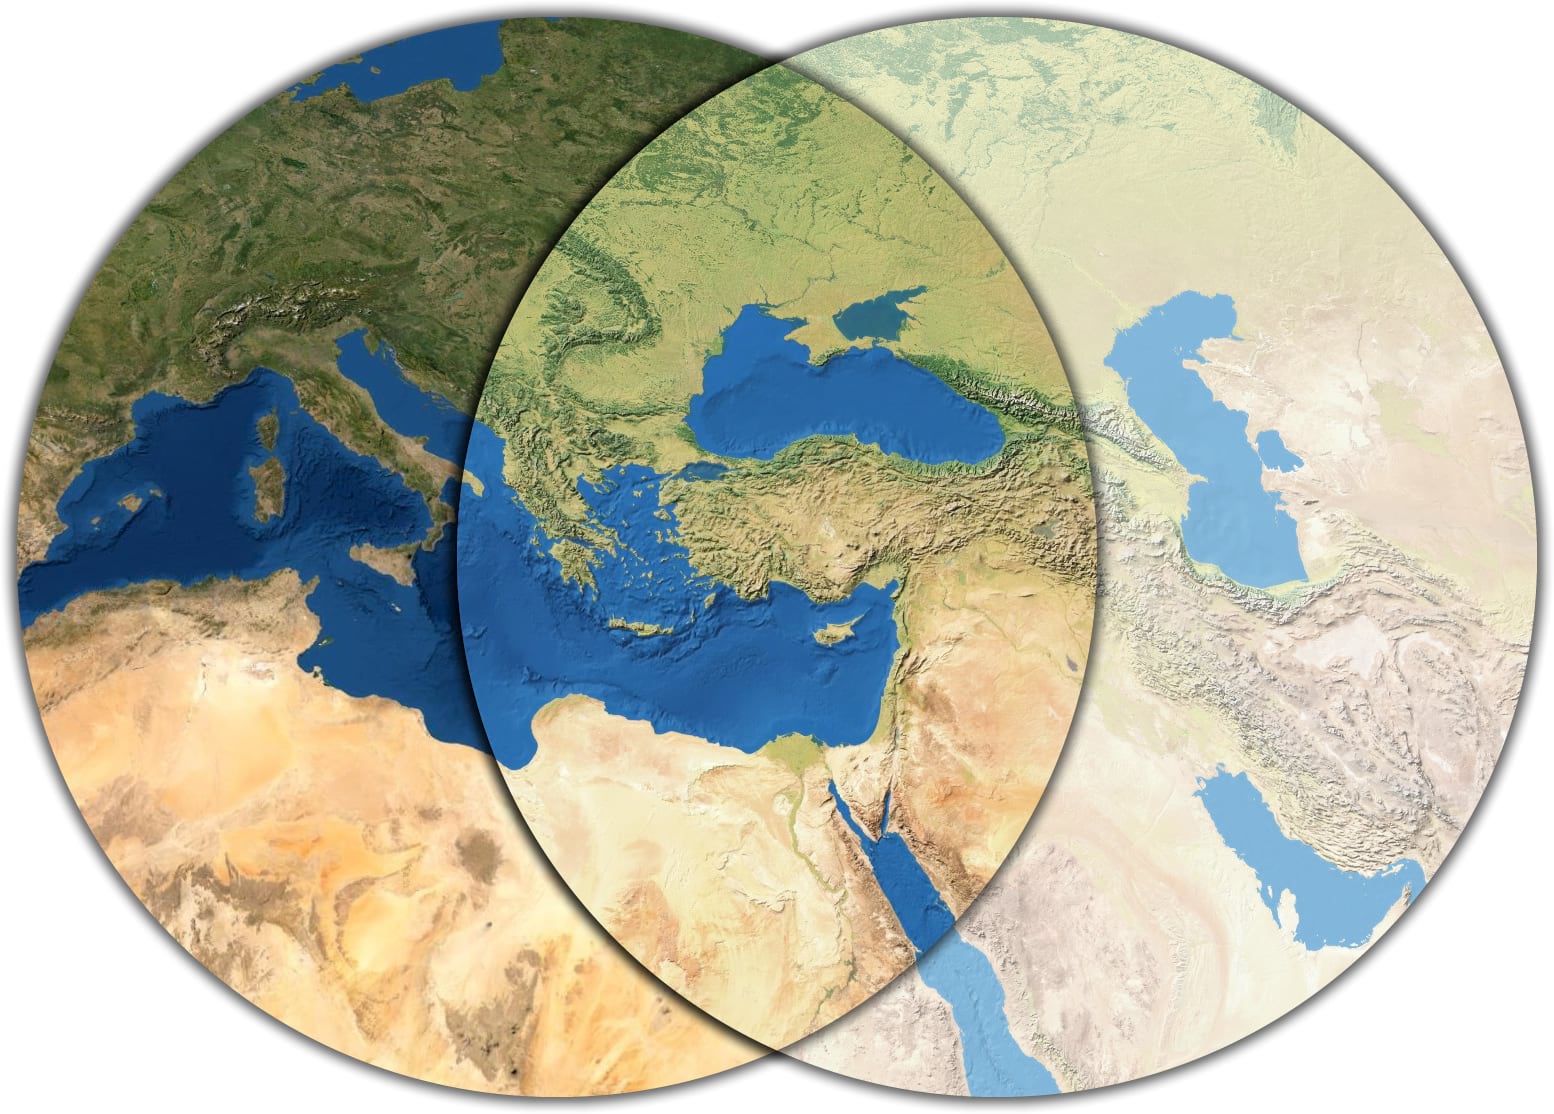
Drawing on a dataset of historical lighthouses and light aids along the English and Welsh coasts between 1514 and 1911—as well as another dataset on global shipwrecks—this lab asks you to visualize the imprint of these guardians of the British empire’s guardians.
Setting up your workspace
As with all labs and activities, set up a workspace by using Windows File Explorer  to create a directory structure where you’ll keep all your files.
Wherever you save your work, your directory structure should resemble something like the following:
lab03_lighthouses/
├─ data/
├─ workspace/
├─ map/
The data folder will contain all the data you need to download for this lab. The workspace folder is where you’ll store your ArcGIS Pro project file, as well as the geodatabase associated with it. Finally, the map folder is just for exporting drafts of the final project.
Preparing the data
Get your spatial data
Download the data and move it from your Downloads folder to your data folder.
It’s a .zip file, so go ahead and unzip it with Right-click ➡️ Extract all ➡️ Extract.
This should create a new folder called 85172_HistoricalLighthouses.
Double-click through each folder until you see these…

… and then double-click once more into the shp folder, which contains:

Shapefiles, in greater detail
By now, you’ve encountered plenty of shapfiles, but you may not have considered why they are structured the way they are.
Each one of these files is a component of the shapefile format, hence the abbreviated folder name shp (short for “shapefile”).
The shapefile is a format for storing and displaying spatial data, created in 1998 by the Environmental Systems Research Institute (often shortened to “ESRI” and now stylized as “Esri”).
It’s a somewhat misleading name because it is not a single file. At minimum, a shapefile must contain at least three “sidecar” files…
- a main
.shpfile - an index
.shxfile - a dBASE
.dbffile
… but often, shapefiles contain more than that. Each file plays a specific and important role in the shapefile’s overall configuration, such as the .sbn and .shn files (spatial indexing), the .prj file (map projection and coordinate system), and the .xml file (metadata about the shapefile’s creation). You’ll rarely, if ever, need to interact directly with these sidecar files. You must never delete them.
Anyway: now you have lighthouse data. Nice!
We’ll download the shipwreck data soon.
Getting organized
Right now, the spatial data you need is nested within a bunch of other junk folders: HistoricalLighthouses is inside HistoricalLighthouses_UkData, which is inside 854172_HistoricalLighthouses. This is not ideal: if you let these junk folders accumulate, they’ll make it difficult to navigate your workspace down the road.
As usual, you should be following the “hierarchical method” of folder organization, which includes eliminating unnecessary sub-folders like the ones you have now. Go ahead and drag the HistoricalLighthouses folder directly into your data folder. Then, delete all the empty ones.
Your directory should now resemble:
lab03_lighthouses/
├─ data/
    ├─ historicalLighthouses/
        ├─ shp/
        ├─ DataGuide.docx
        ├─ HistoricalLighthouses.xlsx
├─ workspace/
├─ map/
Making sense of the data
Go ahead and create a new ArcGIS Pro project file—name it something like lab03.aprx and save it in the workspace folder.
In ArcGIS Pro, navigate to the Catalog pane on the right-hand side of the screen. Refer to this guide if you need a refresher on the Pro interface.
If you don’t see the Catalog pane (or if you ever lose it), click on the View tab on the banner, then click Catalog Pane.
Right-click on Folders ➡️ Add Folder Connection:

Add the data folder to your workspace and unfold your way to the HistoricalLighthouses.shp file. Add it to the map and you should see a bunch of dots display around the coast of England (feel free to Pin the Catalog pane at this point):

Open the Attibute table and take a moment to examine the fields and records. Some, like NAME, are intuitive, while others, like LH_1753, are not.
Using the metadata .docx file that came with your data, answer the following questions:
Q1
- What does
LHmean in the attribute table? - What does
REACHmean in the attribute table? - According to the metadata, what coordinate system should this data be displayed in?
- What are the linear units of the dataset’s coordinate system?
- What are the linear units of the
REACHfields?
Already we can see some tensions emerging between the various linear units in the dataset. We’ll resolve this later on.
For now, in the Contents pane of your ArcGIS Pro project, Right-click on “Map” ➡️ “Properties.” Examine the information in the General tab as well as the Coordinate Systems tab.
Q2
- What coordinate system is the map displayed in?
- What kind of coordinate system is that – geographic, or projected? (Hint: If you can’t remember the difference between these two terms, refresh your memory here.)
- What units does this coordinate system use?
Now that we know what the fields actually mean, and have a greater understanding of the units being measured in the data, we can start our analysis.
A light density risk surface
For the remainder of this lab, you’re going to build what I’m calling a light density surface by calculating the REACH field of lighthouses along the coast. Then, you’ll customize the style of this surface in two ways: first, creating proportional symbols based on a field value; and second, using the Buffer tool. Both of these will require you to fuss with a bit of color theory and blending modes.
After you have a suitable light density surface, you’re going to use the Spatial Join tool to determine how many shipwrecks occurred within the radius of each lighthouse’s reach. In the end, you’ll have a map which displays both light density and shipwreck risk—a light density risk surface, perhaps?—that visualizes where ships have fallen victim to the rocky shoals of the English coast.
Displaying data as proportional symbols
The easiest way to represent the distance of lighthouse reach is via the Symbology tab. To open this:
- Select the
HistoricalLighthouseslayer by clicking on it - Click
Feature Layerin the banner above your Map - Click the Symbology
 button
This will open the Symbology tab on the right side of the screen. Under the Primary symbology header, change “Single Symbol” to “Proportional Symbols”, and set the parameters like so:
- Field =
REACH_1831 - Normalization =
<None> - Unit =
Miles - Data represents =
Radius (1/2) width
The Map view should update dynamically as you make these changes until it resembles:

As explained in the data guide, the REACH field represents the night-time visibility range of lighthouses at certain years. The data guide also mentioned that the units were in miles, which the Symbology easily handles for us.
Now that we’ve got our points displayed as proportional symbols, let’s make a couple of stylistic changes.
The way these symbols are displayed right now doesn’t really let us visualize density. To do that, we can adjust the transparency settings of our features:
- Click the color symbol next to Color
- Select Color Properties…
- Crank up that transparency to
75%and clickOK - Set Outline color to
No color
This is starting to look kind of interesting—instead of a bunch of points that display lighthouse locations, we now have something resembling a light density surface, in which more areas represent locations of higher visibility, and lighter.

However, I don’t like how the colors contrast on my map, so I’m going to make a few changes to the basemap using ArcGIS Pro’s layer blending.
Layer blending
Layer blending is the process of, well, blending layers.
Okay: it’s a bit more complicated than that, but that’s the general idea. Behind the scenes, layer blending works by applying a formula to a feature layer in order to achieve certain visual effects in your map. For example, here’s the Overlay blending mode, per Esri’s layer blending documentation:
| Overlay mode | Formula | Description |
|---|---|---|
 |
\(2ab (if a < 0.5); else (1 - 2 * (1 - a) * (1 - b))\) | If the color value of the background is less than half (more black than white), its color is multiplied by the layer’s color. Otherwise, the Screen blend mode is applied. |
John Nelson from Esri has made a lot of nice tutorials on how to use blending modes for your basemaps, including a guide to getting started with blending modes in general. Check ’em out if you’re so inclined.
Because this is a map of lighthouses, let’s make our proportional symbols pop out against a dark surface as if they were actually illuminating the area. I’m going to do something a little cheeky: blend the basemap into a dark blue project background. To achieve this effect:
Right-clickon the “Map” in your Contents pane and select “Properties”Set the background color to a dark blue. I fiddled with the “Color properties” until I found a HEX code that I liked—
#000056—but you should feel free to choose a color that suits your taste.
Figure 8 Replace the default topographic basemap provided with some satellite imagery. Click the Map tab on the banner at the top of your screen, click Basemap, and select “Imagery.”
Now select the
World Imagerylayer in your Contents pane by clicking on it, and then click the Tile Layer button at the top of your screen.Click the drop-down bar next to Layer blend and select “Overlay.”
Congratulations! You’ve unlocked 🎉Layer Blending🎉. Now you should see something like this:

Pretty neat: the “Overlay” mode has done fancy color math to our basemap, giving it this cool midnight-ish appearance.
It’s better, but we can probably make those proportional symbols pop a little bit more.
Go back into the Symbology pane of your HistoricalLighthouses layer and give it a nice light yellow color. Again, I picked #FFF2D1, but you don’t have to.

Sure, but, but…… sorry, but can’t we make this pop just a little bit more?!?!
In your Contents pane, go ahead and drag HistoricalLighthouses so that it’s underneath the World Imagery layer. Doing so will produce a sort of “revealing” effect, where the the white-yellows of the semi-transparent proportional symbols and the blues of the background combine and neutralize within the blending mode. If you zoom in more closely, you’ll see that the circles now reveal a photorealistic, “normal”-looking satellite image:

You can hold down the Shift key and drag a box on the map to zoom to that view.
Feel free to continue tinkering with parameters here—try different basemaps, test out different colors, use other blending modes—until you get something that feels right to you.
Calculating REACH with the buffer tool
This looks nice, but our proportional symbols layer is not something that we can use to perform real spatial calculations.
We can’t use it to count how many shipwrecks fall within a given circle.
To accomplish that task, we must turn to the Geoprocessing Toolbox.
Buffering, a fundamental geoprocessing workflow, creates “buffer” polygons around input features, to a specified distance.
It helps visualize what kinds of features fall within the specified range, as a teen curator in a recent Leventhal Center exhibition did with common community areas across Boston. More advanced analyses might use the buffer tool to determine a risk area of oil spills from tankers or pipelines.

The input features can be points, lines, or polygons, but the output feature is always a polygon or set of polygons. The specified distance can be a stable number, like 10 miles for all features, or a variable, such as the value of the REACH field for each feature.
Just to get the hang of it, let’s buffer a couple different ways.
Buffering by distance
In ArcGIS Pro, open the Geoprocessing toolbar by clicking Analysis ➡️ Tools. Search for “buffer” in the search bar, and select Pairwise Buffer.
You might notice that the toolbox offers both a Buffer and a Pairwise Buffer. The Pairwise Buffer tool uses parallel processing to compute spatial data more quickly. Nice!
Double-click the Pairwise Buffer tool to open it; then, set the following parameters and click Run:
Input features =
HistoricalLighthousesOutput feature class = click the folder
 and save the output feature class as
 lighthouseBuffer_10miles. If you click in the text box itself, you should see a full file path resembling:..\lab03_lighthouses\workspace\lab03.gdb\lighthouseBuffer_10milesDistance =
10, withLinear Unitset toStatute MilesYou can leave Method, Dissolve Type, and Maximum Offset Deviation at their default settings.
Before you click Run, be sure that you’ve cleared the selection of any records from the attribute table—otherwise, the tool will only run on your selected records.
When it’s finished, turn off your HistoricalLighthouses layer and you should see something like this:

As opposed to the proportional symbols you generated earlier from the HistoricalLighthouses point layer, this is a bona fide polygon layer, with bona fide geometry that we can use for spatial computation.
Data snooping
Let’s do a bit of data snooping to check your work.
Open the attribute table of your new layer, lighthouseBuffer_10miles. There should be four new fields: BUFF_DIST, ORIG_FID, SHAPE_LENGTH, and SHAPE_AREA.
Q3
What is the value of all the records in the BUFF_DIST field?
That certainly doesn’t look like ten miles! We can figure out what happened by manually measuring the buffers.
Under the Map tab, select the Measure  tool. Make sure the measure distance is set to
 Planar and Metric.
Then, zoom into one of the buffered lighthouses—preferably, one that doesn’t have a bunch of other buffers overlapping it—and measure the radius of the circle by Clicking the lighthouse point and then Double-clicking the buffer’s ring.
Mark down the value listed next to “Path net distance” by either typing it out or clicking the Copy results  button. Then, click the Clear
  button and measure the distance again, this time in miles.
Q4
What did you measure for the radius of your buffers, in kilometers and miles? (It doesn’t have to be exact.)
It turns out that the mysterious value in the BUFF_DIST field is meters. As you discovered in Question 2, our data is projected in British National Grid, which uses meters as the default unit of measurement.
Now we’ll buffer against a dynamic variable, rather than a static value, using the REACH_1831 field.
Buffering by variable
Open Pairwise Buffer again. This time, your parameters should resemble:
- Input features =
HistoricalLighthouses - Output feature class =
lighthouseBuffer_1831 - Distance = set to
Fieldand selectREACH_1831 - Again, you can leave Method, Dissolve Type, and Maximum Offset Deviation at their default settings.
Click Run. You shouldn’t really see anything at all, except for a message in the Geoprocessing tab that says “Pairwise Buffer completed with warnings”:

This is actually expected behavior; since there are a bunch of records in the HistoricalLighthouses layer with values of 0 in the REACH_1831 column, buffering them is a mathematical impossibility and they’re skipped.
But still, where’s your buffer layer?
If you remove lighthouseBuffer_10miles from your Contents pane, you’ll notice a bunch of tiny specks across the map. Go ahead and zoom into one of them.

The Pairwise Buffer tool lets you select a field as the specified buffer distance—but it doesn’t allow you to select a unit of measurement. So, when you created lighthouseBuffer_1831, ArcGIS Pro processed it in the default unit of measurement for this coordinate system.
Oofa doofa. We’ll need to do something about this—but before proceeding, let’s take a moment to clean up your Catalog.
To reiterate how ArcGIS Pro saves stuff: every time you run a geoprocessing function, it’s saved by default to your project geodatabase, or a database that is designed to inherently handle all sorts of different spatial data. Your project geodatabase is automatically created in the same folder where you saved your ArcGIS Pro project; in this case, it should be in workspace.
Open your Catalog pane, unfold the workspace folder, and delete these two files from your project geodatabase:
lighthouseBuffer_10mileslighthouseBuffer_1831
Enter, the Field Calculator
We need our REACH fields to display distance in meters instead of miles. In this endeavor, the Field Calculator is a good buddy.
This handy tool allows you to perform calculations both simple and complex on field values within an attribute table.
You should always toggle on Editing mode before making significant changes to a layer or feature class. It allows you to discard changes—from a field calculation, for example—in case you accidentally mangle a dataset beyond reproach. Which I have done many times. And so will you. Follow these instructions to display the Edit button.
Turn on Editing mode by clicking the Edit button, and then crack open the Field Calculator by clicking the Calculate button in the attribute table of the HistoricLighthouses layer:

In our field calculation, we want to multiply the number of miles in the REACH columns by the number of meters in a mile. In other words, we’re turning miles to meters.
This should be a simple process. However, because this is historical GIS work, it is not.
Recall that our data guide listed the units for REACH fields as miles…

… but in their academic article detailing the creation of this dataset, the authors specify that these are in fact nautical miles—a completely different unit of measure from the familiar U.S. survey (or statute) mile of 5,280 feet. The importance of metadata!

FYI: a nautical mile was historically defined as one-sixtieth a degree of latitude, but today it is generally taken to be 6,080 feet.
After nobly plumbing the depths of the digital archive…

… I reasoned that the Magic Number for our meters-to-nautical miles conversion would be 1852.
Field Calculator and Buffer redux
Open the Field Calculator again and set the following parameters…
Input Table =
HistoricLighthousesField Name = type in
meter_1831. This will create a new field with that title in the attribute table. (And when you’re choosing field names, recall that shapefile field names are limited to 10 characters.)Field Type =
Long (32-bit integer). I think some of our values from this calculation may exceed the limit of a 16-bit integer, so we’re choosing 32-bit just to be safe.Expression type =
Python 3. The other option, Arcade, is a proprietary expression language for ArcGIS applications. It’s mostly useful if you’re building apps across the wider ecosystem of Esri software. We don’t need to learn it right now, and moreover, you don’t need to “know Python” in order to compose expressions in the Field Calculatorn—so if you’re unfamiliar with programming and query languages, don’t be too intimidated by this.Expression =
Double-clickon theREACH_1831field. This will automatically add it to the expression dialog, braced by!characters, which tell ArcGIS Pro that the string actually refers to a field. Then, manually type in the Magic Number that I mentioned above.!REACH_1831! * 1852Code Block should stay empty, and Enforce Domains should remain unchecked.
… and click Apply.
When your field appears, you can close the Calculate Field popup by clicking OK and exit Editing mode by clicking the Edit button.
Now run that Pairwise Buffer tool again, but this time, set the Distance field as meter_1831. Note that if the Pairwise Buffer tool is still open from the last time you used it, you may need to close and re-open it for the new meter_1831 field to appear.
Click Run, and you should see something like this:

Before moving on to the next section: replicate this workflow for the other two REACH fields, first calculating them from nautical miles to meters, and then buffering them by their new fields. Don’t forget to set the Field Type to Long (32-bit integer).
When you’re finished replicating this workflow for the other two REACH fields, you should have three layers in total: lighthouseBuffer_1831, lighthouseBuffer_1851, and lighthouseBuffer_1911.
Your map and attribute table should look something like this:


I recommend grouping your light density surfaces together by selecting all three ➡️ Right-click ➡️ “Group.” I named my group lightDensitySurfaces.
Counting shipwrecks
Now that we have three light density surfaces—one for each year that there was available data on reach—we can actually calculate stuff using them.
In this section, we’re going to download some data on shipwrecks and figure out how many have occurred within the boundary of each light density surface layer.
In general, this is a super common GIS workflow. In our case, we’re answering the question: which parts of the English coast are historically dangerous, despite being well-lit?
Get shipwrecks
Download the data and extract its contents to your data folder.
You can also download the data directly from the UK Hydrographic Office, but over the past couple of years, they have frequently changed where they host this dataset—so I find it’s easier to just give you a .zip file.
Then, load the Points.shp file that is buried within the Wrecks_and_Obstructions_Shapefile folder into ArcGIS Pro.
Jump scare! Points everywhere!

Let’s rename this to something more intuitive, like shipwrecks.
Q5
How many points are in the shipwrecks layer?
Clip-wreck data
Set aside, for a moment, the harrowing reality that the English Channel and its entire environs is basically a maritime graveyard. On a practical note, we don’t need all of these points: they’ll slow down general performance of the software if we don’t clear them out first.
Thankfully, the Clip tool makes it pretty easy to get rid of unwanted points. This tool extracts input features that overlay the clip features. Like the buffer, it’s another geospatial classic. 🤟
And since we want to preserve shipwrecks that fall within any of our three light density surface layers, let’s go ahead and Merge them together to create a clip layer. Try this Clip-Merge workflow:
- Geoprocessing ➡️ Merge
- Input Datasets =
lighthouseBuffer_1831,lighthouseBuffer_1851, andlighthouseBuffer_1911 - Output Dataset =
lighthouseBuffers_merged - Leave everything in Field Map untouched
- Input Datasets =
- Geoprocessing ➡️ Clip
- Input Features or Dataset =
shipwrecks - Clip Features =
lighthouseBuffers_merged - Output Features or Dataset =
shipwrecks_clipped
- Input Features or Dataset =
The Clip might take a bit longer to run, since it has to process so many points—but believe it or not, there’s something called “spatial indexing” going on under the hood of ArcGIS Pro that makes this process much faster than it could be. While you’re waiting, feel free to read about it. Or, you know, just zone out.
When it’s finished running, remove shipwrecks from your Contents pane. The output should resemble this:

Open up the shipwrecks_clipped attribute table. There’s a ton of data in here that you could do interesting stuff with, but we’re only concerned with one field: date_sunk. (Just as a point of order, this data doesn’t have any real meaningful field-by-field metadata associated with it, which kind of sucks, so we’re stepping into a realm of greater uncertainty.)
Since our main light density surface layers are associated with specific years, we want to be able to select and filter these points based on year as well. Two things are stopping us:
- The
date_sunklayer is filled out inyyyymmddformat, when we wantyyyy - The
date_sunklayer is encoded asTextdata, notInteger
Press the Edit button under the Edit tab, and we’ll fix both of these issues:
- Sort the
date_sunkfield in descending order byRight-clickingthe header name ➡️ “Sort Descending,” and then manually remove any records with no value in thedate_sunkfield by selecting and deleting them. This should leave you with 5,702 records. - Open the Field Calculator
- Input Table =
shipwrecks_clipped - Field Name =
year_sunk - Field Type =
Short - Expression Type =
Python 3 - Set the expression dialog to:
!date_sunk![0:4]. In Python, this is called a substring. Let’s break it down:!date_sunk!= the variable name[= open the substring expression0= how many characters to remove from the left/front of the specified string:= separator4= how many characters to remove from the right/end of the specified string
- Since our dates are consistently formatted, we can use a simple substring to strip
mmddfrom the right, retaining onlyyyyyat the left. - Again leave Code Block and Enforce Domains untouched.
- Input Table =
Click Apply and check the attribute table to see if your calculation succeeded.
If you hover your cursor over the year_sunk header, you should see a popup that tells you what kind of data type it is.

When things look right, go ahead and exit the Field Calculator, click the Save button to save your edits and the Edit to leave editing mode, and proceed to the next section.
Associate stuff with other stuff
We now have three light density surface layers for three different years, and one big cluster of points that falls within that same area.
The task at hand: associate each point with its appropriate light density surface based on our new year_sunk column.
For this task, we’ll rely on Spatial joins, which make stuff associated with other stuff according to the stuffs’ location. You can read a smart explanation of the tool in Esri’s documentation.
First, let’s make use of that new year_sunk column.
The logic
We want to avoid joining shipwrecks to a lighthouse that didn’t exist when the wreck occurred—for example, it wouldn’t make much sense to join a shipwreck that perished in 1850 with a lighthouse that didn’t exist until 1911. So, we’re going to join only those records that match the breaks in our data.
For the sake of this lab, here are the breaks we’ll use:
- All
shipwrecks_clippedrecords whereyear_sunkis greater than 1799 and less than 1851 will be joined tolighthouseBuffer_1831 - All
shipwrecks_clippedrecords whereyear_sunkis greater than 1850 and less than 1911 will be joined tolighthouseBuffer_1851 - All
shipwrecks_clippedrecords whereyear_sunkis greater than 1910 and less than 1914 will be joined tolighthouseBuffer_1911
My logic to terminate the break by 1914 is that the battles of World War I could skew our data.
My logic to initiate the break at 1800 is I wanted to include a few more points on the older end, and this is just a learning lab, so I’m not super concerned that we might be attaching a few wrecks to lighthouses that don’t yet exist.
Select by Attributes
Click the Select by Attributes button at the top of your attribute table and compose a query where year_sunk is greater than 1799 and less than 1851. It should look exactly like this:

While you’re here, toggle the SQL button just above the query builder.
SQL, short for Structured Query Language, is a standardized query language for retrieving data from a database, file, or in this case, a feature class. Eventually, you might find it easier and faster to make these sorts of queries by simply typing them out in SQL rather than clicking through the query builder.
Once you click Apply, a little message will pop up beneath the Input Rows:
"The input has a selection. Records to be processed: 71."Nice! Click OK to exit the Select by Attributes dialog, and let’s process those records.
Spatial joins
In your Contents pane, Right-click the lighthouseBuffer_1831 layer ➡️ “Joins and Relates” ➡️ “Add Spatial Join”:
- Target Features =
lighthouseBuffer_1831. This is the layer to which we are joining our desired features. - Join Features =
shipwrecks_cipped. These are the desired features to be joined. It should say “The input has a selection. Records to be processed: 71.” If it doesn’t say that, double back and run your selection query again. - Match Option =
Completely contains - Leave Search Radius empty, but unfold the Fields header and remove all the empty fields except for
year_sunk
Click OK and you should see the attribute table for lighthouseBuffer_1831 update. Look for a field called Join_Count. That field tells us how many shipwrecks landed in a given lighthouse buffer area.
Lastly, Right-click on the lighthouseBuffer_1831 layer and select Data ➡️ Export Features. Then, save it in your project geodatabase as lights1831_joined. This final step actually saves the spatial join into the feature class itself, rather than saving it in memory on the ArcGIS Pro project.
Run it back
Now complete this process again for lighthouseBuffer_1851 and lighthouseBuffer_1911:
- Query
shipwrecks_clippedso that theyear_sunkfield reflects the appropriate breaks - Spatially join the selected features to their respective light density surface layers
- Export the spatially joined layer as a new feature class
Pay close attention to the numbers you’re using for greater/less than queries. When you’re done, use the “Sort Descending” feature of the attribute table to determine the following questions:
Q6
- What is the largest value in the
Join_Countcolumn in thelights1831_joinedlayer? - What is the largest value in the
Join_Countcolumn in thelights1851_joinedlayer? - What is the largest value in the
Join_Countcolumn in thelights1911_joinedlayer?
🎉 Congratulations! 🎉 These last steps, hopefully, will be more fun: you’ll see your light density risk surface come together with a nice design.
Designing our light density risk surface
Go ahead and drag your light density surfaces back underneath the World Imagery layer, if they’re not already under it.
Starting with lights1831_joined, open the Symbology pane.
From the Primary symbology drop-down menu ➡️ “Graduated Colors” ➡️ set the following parameters:
- Field =
Join_Count - Normalization =
<None> - Method =
Manual interval - Classes = 4
- Color scheme = pick a “Continuous” scheme that starts at white and ends at red (it’s okay if there’s orange in the middle). Also, click on the gear next to the color palette drop-down menu and change the setting to “Apply to fill and outline.”
- Set your classes to:
- Upper value ≤ 0
- Upper value ≤ 1
- Upper value ≤ 3
- Upper value ≤ 21 (for
lights1831_joined), 249 (forlights1851_joined), and 12 (forlights1911_joined)
It should look something like this:

When you’re representing data that changes across time, you have to use the same class breaks for each layer. That’s why we didn’t choose “Quantile” or “Natural breaks” representation in this case.
Now, click on the color palette drop-down menu and click “Format color scheme…”, and change the transparency to 80% on each of the little tick marks:

Click OK. Make sure it resembles something like this:

At this point, you should update the layer blending options for your layers from “Overlay” to “Hard Light”; this will improve the blending!
Then open the “Format color scheme…” menu again, click “Save to a style…”, and save your style as “Light density risk surface.”
Now, you can replicate this formatting more easily in your other two layers, lighthouseBuffer_1851 and lighthouseBuffer_1911. When you’re finished adding the exact same formatting to those two layers, you should have a map that looks like this:

Here’s what we’re seeing: the darker the red, the greater the number of shipwrecks within a certain lighthouse range, and the brighter the color, the greater the number of lighthouses at all.
The way that we’ve composed this data does have a few flaws. For example, with this method, lighthouses that appear in 1831, 1851, and 1911 will add a “false” brightness to the map because they overlap themselves. We could solve this by adding raster analysis with map algebra into our workflow, but you’ve suffered enough: that’s a task for another day.
Finishing touches in ArcGIS Online
ArcGIS Online, the cloud version of ArcGIS Pro, has a pair of functions—Bloom and Blur—that are critical to putting finishing touches on this map. They’ll smooth out those hard edges on the buffers.
Share as web map
In the Contents pane, Right-click on your “Map” ➡️ “Properties” ➡️ “Coordinate Systems” ➡️ change the coordinate system to WGS 84 Web Mercator. Unlike desktop GIS, online maps play best with the Google-developed Web Mercator projection.
Once you’ve done that, you can open the Share tab and click “Web Map.” Set the Share As Web Map parameters like so:
- Give it a distinctive name (e.g., “Ian’s lighthouse risk assessment, 1800-1913”)
- Write short summary of the map and the data
- Skip tags
- Configuration =
Copy all data: Exploratory - Location = your root folder
- Check the box to share with
Tufts University
Click the Analyze button to ensure you’re not missing any steps, and then click Share to send it to publish it in the Tufts ArcGIS Online organization!
You might see errors as you are trying to share this project as a web map. If so, try renaming some of your layers in the Configuration tab in order for the publication to process.
Once it’s published, you can click “Manage the web map” to view it in a web browser. You might have to sign into your account again through the browser.
Once you’re in, click “Open in Map Viewer” to see your map online.

Add blur (and other stuff, if you want)
If you’ve never used ArcGIS Online before, it’s super intuitive and works quite similarly to Pro. You’ll probably see something like this when you open the map:

In ArcGIS Online, you can’t place layers underneath a basemap. Thankfully, you can still add a satellite imagery layer easily.
- Much like ArcGIS Pro, the left-hand side of the screen contains all your contents and layers, while the right-hand side houses the various “panes” – geoprocessing, symbology, and so on.
- Click into the Layers tab at the top of the left-hand side of your screen – you should see
lights1831_joined,lights_1851_joined, andlights1911_joined—and click the Add button beneath them. - Click where it says My content, select Living Atlas, and search for “Imagery.”
- “World Imagery” should be the first hit: select it and click “Add to map.”
- It will land on top and cover everything up, just like we want it to. Adding it should also have triggered the Properties tab to open from the right-hand side.
- Collapse the Symbology header, and that should reveal the blending options. Change it from “Normal” to “Hard light.”
Voila! Your map is back.
Now you need to redo transparency on each of the lights layers. While you’re at it, you can add Bloom and Blur features to perfect this map’s style.
- In the Layers tab on the left-hand side, click the
lights1831_joinedlayer to select it. - Under the Appearance header in the Properties tab on the right-hand side, toggle the transparency back up to
80%. - Then, click on the Effects tab on the right-hand side of your screen. It should be just a few boxes down from Properties.
- You should see a big list of “effects.” Start by turning on Blur and cranking it up to
10. - Now replicate this for the other two layers. The app should even be smart enough to remember that you picked
10.
Now, you’ve got a proper map of lighthouses, with a lovely blur effect at the edges of the buffers that gives the viewer the sensation of natural light:

Exporting your final map
Before you submit, feel free to play around a bit with the Bloom effect to see how it combines with Blur. You could also try changing the color to a different shade of blue (or maybe away from blue altogether). You might also find that in ArcGIS Online, the transparency doesn’t need to be quite so high – maybe try setting it at 50, or even leaving it at 0 to see what happens (I kind of liked leaving transparency at 0 and sorting the layers newest to oldest). Lastly—and especially if you leave the transparency at 0—note that the layer ordering affects the final map quite a lot.
When you’re ready to submit the map, click Print at the bottom of the sidebar on the left-hand side of the screen. Give it a decent title, set Page Setup to A3 Portrait and File format to PNG32, and click Export.
The exported file will appear in a new tab. Save a copy of it, name the file appropriately, and submit via Canvas, along with a Word document with answers to the questions throughout this lab.
Questions and deliverables
| Assigned | Due | Submit |
|---|---|---|
Mar 3, 2026 |
Mar 12, 2026 |